Scientific Investigations Report 2007–5173
U.S. GEOLOGICAL SURVEY
Scientific Investigations Report 2007–5173
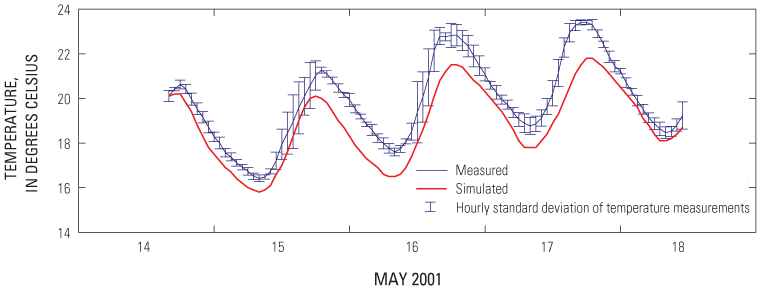
Figure 3. Hourly temperature model validation of pond 3 of the Napa–Sonoma Salt Pond Complex. Bars on the measured temperature time series indicate the standard deviation of the nine simultaneous measurements taken at three depths and three locations in the pond.

![]() U.S. Department of the Interior | U.S. Geological Survey
U.S. Department of the Interior | U.S. Geological Survey
URL: https://pubs.usgs.gov/sir/2007/5173
Page Contact Information: Publications Team
Page Last Modified: Thursday, 01-Dec-2016 19:57:58 EST
