Scientific Investigations Report 2007–5180
U.S. GEOLOGICAL SURVEY
Scientific Investigations Report 2007–5180
When a pesticide is first applied, most of it is bound to soil or plant surfaces. When irrigation water or rain reaches a treated field, a portion of the pesticide dissolves into the water. The amount of pesticide that dissolves in the water is controlled by a property of the pesticide called its organic carbon-water partitioning coefficient, or Koc. A pesticide with a large Koc value will remain largely bound to the soil or plant material and only a small amount will dissolve in the water. Conversely, a pesticide with a small Koc value will detach more readily from the soil or plant material and dissolve in the water. The maximum amount of pesticide that will dissolve in the water is limited by the solubility of the pesticide. Koc values for currently used pesticides range from less than 10 (dicamba, clopyralid) to more than 100,000 (bifenthrin, oxyfluorfen).
In most soils, the fraction of organic material is small compared with the inorganic mineral fraction (sand and clay), however, this small fraction of organic material is responsible for most of the pesticide retention capacity of soils. Soils with more organic material potentially can retain more pesticides than soils with a lesser amount. The organic-matter content of soils from catchments in this study ranged from 0.4 to 1.2 percent by weight (mean = 0.57, standard deviation = 0.22), which is low compared to other agricultural soils in the United States (typically around 5 percent organic-matter content [Brady and Weil, 2002]). There was no discernible difference in the instream pesticide concentrations or pesticide losses due to differences in soil organic matter at the sites in this study; however, this may have been due to the resolution of the soils data available for the Yakima River Basin at the time of this study.
Many factors affect the mobility of pesticides in the environment, such as the manner, amount, frequency, and timing of application; the method of irrigation; the chemical properties of the pesticide; soil properties; land slope; and proximity to flowing water. The poor relation between application rates and detection frequency from the July 2000 sampling (fig. 8) illustrates the end result of a multitude of contingencies that determine the fate of a pesticide after it is applied. Some pesticides, such as the insecticides azinphos-methyl and chlorpyrifos, were detected less often than expected solely on the basis of their application rates. Conversely, some pesticides, such as the herbicide atrazine, were detected more frequently than expected. Among the universe of possibilities, two factors explained a large part of the variation observed in samples collected from small agricultural catchments in July 2000: the Koc value (see Sidebar 2: Organic Carbon-Water Partitioning Coefficient, Koc) and the method of irrigation. The Koc value for each pesticide (U.S. Department of Agriculture, 2005) is included in figure 8. Pesticides with a high Koc value were detected at a lower frequency than might be expected for their application amounts; whereas, pesticides with a low Koc value were often detected at a higher frequency than might be expected for their application amounts. This general pattern was not observed with other pesticide physical properties such as solubility, half life, or volatility.
Further study of figure 8 shows some exceptions to this generality. For example, the Koc values for the herbicides simazine and atrazine are similar, yet atrazine is detected more frequently than simazine despite less usage. Most simazine use is in orchards and vineyards, many of which use sprinkler or drip irrigation; whereas, most atrazine use is on corn, which mostly is rill irrigated. Thus, knowledge of the irrigation method in addition to the Koc values provides more insight into pesticide movement than the Koc values alone.
One method to quantify the relation between pesticide applications and detections is to calculate the pesticide loss, which is a ratio of the mass of pesticide in the stream to the mass applied. Besides compressing application and detection data into a single value, the advantage of a mass-based loss statistic is that the data are normalized to catchment size and stream flow, and, therefore, comparison among catchments can be made readily. For additional examples of the use of pesticide loss statistics refer to Larson and others (1997) and references therein.
Using estimated pesticide-application data for 2000 and the pesticide concentrations and discharge from July 2000, the pesticide loss was calculated for each pesticide in each catchment. Because the contributing area to a canal is indeterminate, samples from canals are excluded from this part of the analysis. The pesticide loss was calculated as follows:
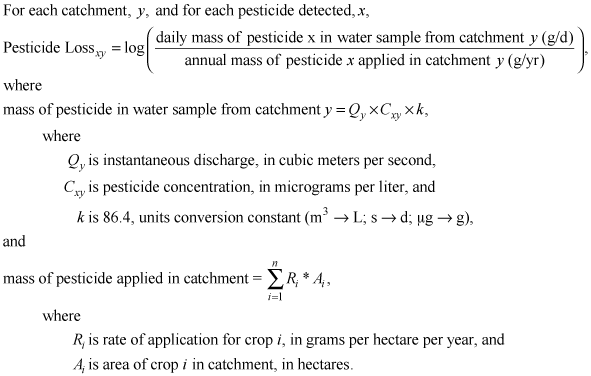
Because the loss values span nearly eight orders of magnitude, the common log (base 10) of the resulting value was used. The units conversion factor scales the calculated runoff mass to a daily value, that is, the instantaneous mass measured at the time of sampling is considered to be representative of the daily mass moving through that waterway. The applied mass is calculated using only applications expected to have been made through the end of July.
Large annual variations in pesticide concentrations have been measured in streams and drains of the Yakima River Basin by various studies conducted since the late 1980s (Rinella and others, 1999; Ebbert and Embrey, 2002; U.S. Geological Survey, 2007). The pesticide losses calculated and discussed herein represent the concentration measured once at each site during a 2-week period in July 2000. Despite the limited temporal nature of this data set, meaningful insights into pesticide-transport processes are possible due to the large spatial coverage and the large number of pesticides analyzed.
The calculated pesticide losses are shown in figure 9. The loss data are arranged along the x-axis in order of increasing Koc value. At higher Koc values there are fewer high-loss values and more low-loss values. The amount of variation of losses for any single pesticide is considerable, ranging up to five orders of magnitude. This relation is quantitatively depicted in figure 10 by substituting the Koc value for pesticide along the x-axis. Despite large variability, a highly significant (p < 0.0001) negative correlation between Koc and pesticide loss was observed. Larger pesticide losses were associated with pesticides having low Koc values compared with pesticides having high Koc values. In other words, for pesticides with low Koc values, a larger fraction of the applied pesticide was transported off the field and into waterways.
More than one-half of the potential-loss values could not be calculated because the pesticide was not detected at the site. In some cases, the pesticide truly may not be present. In most cases, the more likely scenario is that it was present, but at a concentration below the detection limit of the laboratory. To better assess the full range of potential-loss values, a small, but nonzero concentration was assumed to be present in waters with no detections. A concentration of 0.0001 µg/L was chosen, which is approximately one order of magnitude smaller than the lowest RL. The results of this exercise are presented in figure 10. A similar trend of decreasing loss with increasing Koc is apparent in the loss values estimated for nondetected concentrations.
The relations presented in figures 9 and 10 are weak considering the large variability in the loss values for any given Koc value. To attempt to improve the relations, additional explanatory variables were considered in the analysis, including solubility, soil half-life, soil-clay content, soil erosivity, soil organic-matter content, soil permeability, catchment area, catchment slope, irrigation method, and crop type. Among these, only irrigation method provided further insight into the relations observed in figures 9 and 10.
Figure 11 shows the relation between pesticide loss and the percent of the catchment using sprinkler or drip irrigation. A clear pattern emerges when losses are grouped by Koc value. Losses of pesticides with Koc values greater than or equal to 300 were assigned to the “high” group, and less than 300 were assigned to the “low” group.
Losses of pesticides with high Koc values declined as the percentage of sprinkler and drip irrigation increases (fig. 11). This relation is due to both the sorptive nature of the pesticides and to a reduction in sediment washed from fields in catchments with widespread use of sprinkler and drip irrigation. Because of a greater affinity to soil and other organic material, pesticides with high Koc values are more likely to have a longer residence time at the place of application, which increases the time for physical and biological processes to degrade the chemicals. Onfield residence time is further increased by the use of sprinkler or drip irrigation, which produce little or no sediment-bearing runoff (fig. 12) compared with rill irrigation.
Despite the significant positive correlation between suspended sediment and loss of high Koc pesticides (fig. 13), a negligible fraction of most pesticides is sorbed to the suspended sediment measured in the stream. Squillace and Thurman (1992) calculated that 99 percent of the atrazine is transported in the dissolved phase, even at relatively high concentrations of suspended sediment (700 mg/L). Their result was corroborated by laboratory analyses that demonstrated no analytical difference between the concentration of atrazine in a centrifuged sample and the concentration of total atrazine in unfiltered, uncentrifuged water. For the purposes of this report, atrazine is considered to have a low Koc value (around 100 mL/g); however, Ebbert and Kim (1998) calculated the theoretical dissolved fraction for a hypothetical pesticide with a moderately high Koc value (20,000 mL/g) and determined that it also should occur primarily in the dissolved phase (97 percent). Rinella and others (1999) calculated the fraction of total pesticide expected to occur in the dissolved phase for a range of Koc values (5,000–4,000,000 mL/g) and suspended-sediment concentrations (0–1000 mg/L) of known organic-carbon content in Yakima River Basin waterways. On the basis of the results of Rinella and others (1999), most pesticides with high Koc values currently used in the Yakima River Basin should occur primarily in the dissolved phase. Major exceptions include pyrethroid insecticides and oxyfluorfen, a diphenyl ether herbicide, which have Koc values greater than about 100,000 mL/g. At suspended-sediment concentrations commonly measured in streams and drains in the Yakima River Basin, up to one-half of the total mass of these pesticides with Koc values exceeding 100,000 mL/g might be sorbed to suspended sediment.
Suspended-sediment concentrations decreased with increasing use of sprinkler or drip irrigation at sites in the Mid Valley and Lower Valley. However, the trend was apparent only among sites where the sprinkler or drip was used in more than about 40 percent of the catchment. At smaller percentages of sprinkler or drip use, there is no relation between suspended-sediment concentration and irrigation method, although the data are sparse, and may be an artifact of the time sampling, onfarm sediment-management practices, or dilution by large inputs of canal spill or ground water.
In contrast to the relation observed among sites in the Mid Valley and Lower Valley, sites in the Kittitas Valley had no relation with irrigation practices and relatively low suspended-sediment concentrations, despite the fact that farms in this region have not widely adopted sprinkler- or drip-irrigation methods. Low suspended-sediment concentrations in the Kittitas Valley are most likely a result of the extensive fields of timothy hay for which the region is known. Timothy hay is a multiyear crop and establishes dense networks of roots near the surface that help retain soil despite the use of rill irrigation.
The important relation between suspended sediment and pesticides is not at the scale of the stream or drain, but rather at the field scale where soil is first entrained and suspended by surface irrigation. It is here where significant desorption from soil particles occurs due a change in soil to water ratio. Equilibrium partitioning favors desorption of even high Koc compounds from the soil, a process described in detail by Squillace and Thurman (1992) for atrazine in the Midwest United States, but applicable to the desorption of all pesticides. The observed relation between suspended sediment and pesticide loss is largely an effect of the irrigation method rather than a direct relation between the suspended sediment in the waterway and the pesticide loss (see Sidebar 3: Relation Between Irrigation Method and Suspended-Sediment Concentration). The implication for managing rill-irrigated fields is subtle, but important. Most farmers who use rill irrigation on their fields in the Yakima River Basin employ one or more sediment-control measures on their property. Measures that prevent sediment suspension during irrigation such as mulching furrows or the use of polyacrylamide (PAM) likely are to be more effective at preventing pesticides from leaving the field compared to sediment-control measures that prevent the off-farm migration of sediment-laden tail water such as grass-filter strips or sediment-retention ponds.
One final group of data has relevance to the issue of movement of high Koc pesticides. As was noted earlier in the text, water collected from drains and streams during the October 2000 sampling was a good surrogate for the chemistry of the shallow ground-water system. With the exception of the DDT degradate, p,p´-DDE, all pesticides detected during this sampling had Koc values less than or equal to 600 (table 8). Of the 27 detected pesticides, 19 had Koc values less than 300. Pesticides with Koc greater than 300 were infrequently detected or occurred at low concentrations. This pattern of occurrence suggests that pesticides with high Koc values are being degraded or they are bound tightly to the soil and are not flushed routinely into the shallow ground water. All of the highly toxic pesticides included in this study had Koc values greater than 300, and therefore widespread ground-water contamination by this group of pesticides is unlikely.
There was no significant relation (p = 0.2844) between method of irrigation and losses of low Koc pesticides (fig. 11) in data collected for this study. The lack of a strong association with irrigation method might be due to several confounding issues. First, many pesticides with low Koc values are pre-plant or pre-emergent herbicides, and typically are applied between late April and early June. By mid-July, a large portion of the mass already may have been washed off the fields, thereby weakening the ability of this study to detect a relation with irrigation method. Although pesticides with low Koc values do not strongly sorb to the soil, the use of rill irrigation is still expected to more readily transport these pesticides to streams and drains because the travel time through the soil and ground-water systems is orders of magnitude longer than overland flow. Second, in some catchments, the irrigation water delivered to the field already contains measurable amounts of pesticides (table 9), and most of these pesticides have low Koc values. A lack of information about irrigation-water deliveries prior to and at the time of sampling precludes any attempt to estimate the importance of this source. Pesticides might be introduced to canal water in several ways, including discharge of field runoff directly into canals, drift, overspray, or atmospheric deposition. The third issue confounding the interpretation of the low Koc group of pesticide-loss data is related to right-of-way applications. Herbicides used for weed control along rights-of-way include 2,4-D, diuron, bromacil, sulfometuron, and dicamba, and all except diuron are classified in the low Koc group. Most rights-of-way in the study catchments were along alignments of roads, canals, and drains. The use of herbicides on rights-of-way in close proximity to intermittent or perennial waterways increases the likelihood that this group of herbicides will be detected in the region’s surface water. Assessing the prevalence and importance of this issue was not within the scope of this project, but it may have contributed to the lack of trend among the low Koc pesticides.

![]() U.S. Department of the Interior | U.S. Geological Survey
U.S. Department of the Interior | U.S. Geological Survey
URL: https://pubs.usgs.gov/sir/2007/5180
Page Contact Information: Publications Team
Page Last Modified: Thursday, 01-Dec-2016 19:51:56 EST
