Scientific Investigations Report 2007–5216
U.S. GEOLOGICAL SURVEY
Scientific Investigations Report 2007–5216
Streambed hydraulic conductivity was estimated using grain-size analyses and slug tests. Although slug tests measure hydraulic conductivity values that depend on horizontal and vertical flow, and hydraulic conductivity values from grain-size methods are nondirectional, the two methods are directly compared for the purpose of characterizing streambed hydraulic conductivity.
A total of six sediment cores were collected from near each of the in-stream monitoring well pairs depicted in figure 15, and sieve test analysis was conducted on each core. The cores were collected at the sediment–water interface, and the length of collected cores ranged from 25 to 46 cm. Core samples consisted of a homogeneous medium-to-coarse grained, well-sorted sand. The weight percent from each sieve size class was used to calculate a cumulative weight percent, and a grain-size distribution curve was generated for each core collected. The resulting curves depicted in figure 16 represent the grain-size distribution curves for the samples collected at the upstream and downstream transects. These curves were used to approximate the hydraulic conductivity of the streambed sediments by the Hazen approximation. This method is applicable to sands where the effective grain size is between approximately 0.1 and 3.0 mm.
Grain-size distribution curves can be used to estimate the hydraulic conductivity of sands where the effective grain size is between approximately 0.1 to 3.0 mm (Fetter, 2001) by applying the Hazen method (Hazen, 1911). The effective grain size, d10, is the size corresponding to the 10 percent line on the grain-size distribution curve and represents passing of 10 percent finer (by weight) of the sample during the sieve analysis. These values from the generated grain-size distribution curves were applied to the Hazen approximation for hydraulic conductivity as follows:
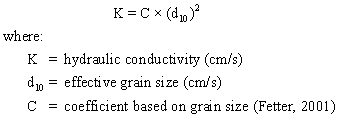 (1)
(1)
Slug tests were performed on 18 of the 20 monitoring wells located at the study site on September 20 and 21, 2004. Eight of the slug tests were performed on the riparian bank monitoring wells screened at approximately 3.5 and 5 m below land surface, and 10 were performed on the in-stream monitoring wells screened at approximately 0.5 and 3 m below the sediment–water interface. Two different slugs were used; both were made of out of PVC plastic tubing, filled with sand, capped and sealed (dimensions: 45.7 cm by 3.2 cm and 91.4 cm by 3.2 cm, or 1.5 ft by 1.25 in. and 3 ft by 1.25 in.). The larger slug was used in the monitoring wells that were screened at greater depths, and the smaller slug was used in the monitoring wells that were screened at shallow depths. Aquistar PT2X pressure transducers were used to measure and record the head changes during these slug tests. The transducers were set to record at 0.1-second intervals and allowed to equilibrate with the well before the slug was dropped or removed. The recovery time for each individual slug test ranged from seconds to minutes, and only one monitoring well (BW-016) did not fully recover between tests. This well was screened in a silty-clay layer. Figure 17 depicts the typical recovery time and fit of data for estimating hydraulic conductivity.
The Bouwer and Rice (1976) application was used from the AQTESOLV software program to estimate hydraulic conductivity from slug tests. The collected water-level displacement data for each set of slug tests input into the program included only the data beginning with the maximum displacement of water level and assigned time zero. The form factor that AQTESOLV applies to the Bouwer and Rice (1976) solution for an unconfined aquifer assumes the form factor described in Fetter (2001).
The calculated hydraulic conductivity results of the applied grain-size analysis and slug test method were compared. During low-flow conditions, sediment core samples were collected in August 2004, and slug tests were conducted in September 2004. Sediment core samples used to determine hydraulic conductivity were approximately 25–46 cm in length, and therefore, could be compared with slug tests performed in the shallow in-stream monitoring wells screened at approximately 0.5 m below the sediment–water interface. Estimates of hydraulic conductivity for bank wells are by slug test only, as sediment core samples were not collected for these sites. Tables 6 and 7 present the results of applied methods for the upstream and downstream transects, respectively.
The estimated hydraulic conductivity for the upstream transect by slug test ranged from 40 to 250 m/day, whereas that for the downstream transect ranged from 10 to 100 m/day. A relative percent difference (RPD) was used to describe the variability in estimates of hydraulic conductivity by grain-size analysis and slug test. Variability in applied methods at the upstream transect ranged from 0 to 9 percent, in which both RW-089 and RW-080 resulted in estimated hydraulic conductivities of 50 m/day. Estimates of hydraulic conductivity for the downstream transect showed greater variability, with a range of 80 to 133 percent between applied methods. Location of screened interval likely explains variability in range of estimates. BW-016 was screened in a silty-clay layer, and pebbles and cobbles were encountered during the installation of the in-stream wells RW-098 and RW-090. The sieve test analysis and slug tests were conducted within one month of each other, and therefore, represent a “snapshot” of hydraulic conductivity during 2004 summer low-flow conditions.

![]() U.S. Department of the Interior | U.S. Geological Survey
U.S. Department of the Interior | U.S. Geological Survey
URL: https://pubs.usgs.gov/sir/2007/5216
Page Contact Information: Publications Team
Page Last Modified: Thursday, 01-Dec-2016 20:00:30 EST
