Scientific Investigations Report 2007–5237
U.S. GEOLOGICAL SURVEY
Scientific Investigations Report 2007–5237
The study-area simulation model was linked to optimization methods to produce the Nitrate Loading Management Model (NLMM). This section includes a description of how the management model was formulated, how it is solved, and how it can be used to evaluate alternative strategies for managing nitrate loading to the shallow ground-water system.
To use optimization methods, management goals must be formulated into a mathematical structure. The structure of an optimization problem has three components that must be defined: decision variables, an objective function, and constraints.
One inherent value of the optimization approach is that its use requires decision makers and stakeholders to quantify planning goals and objectives as well as environmental and other constraints. The La Pine NLMM was formulated through a close collaboration with Deschutes County planners and resource managers. The management objective of the NLMM, to minimize the reduction from base scenario nitrate loading from on-site wastewater systems, reflects the goals of: (1) allowing as many platted lots as possible to be developed under current development goals and policies, and (2) minimizing the required reduction in nitrate loading from existing on-site systems. Because costs are associated with reducing loading either by not allowing development or using advanced treatment on-site wastewater systems, the management objective can be simply stated as “minimize the cost” of meeting water-quality goals. The water-quality goals are constraints on the management model and have direct and quantifiable effects on the solution (or cost) and their values often reflect regulatory requirements or economic and community values. If regulatory standards apply, the process of setting water-quality constraints is straightforward. However, if less well defined economic or community values are to be the basis for water quality constraints, then a trade-off analysis is a common process for finding the balance (or evaluating the relations) between costs and economic, aesthetic, health, environmental, and other benefits. The management model can assist in this process by quantifying the relationships between constraints and management objectives.
The NLMM was formulated mathematically to minimize the reduction in nitrate loading (or cost of reduction) from base scenario loading, subject to constraints on minimum reductions in ground-water nitrate concentrations (relative to base scenario), minimum reductions in ground-water discharge nitrate loading to streams (relative to base scenario), and minimum and maximum loading reductions for existing and future homes in each management area.
The decision variables in the La Pine NLMM were the reduction in nitrate loading (relative to base scenario nitrate loading rates) that would be needed to maintain or achieve desired water-quality conditions. See table 6 for a description of the base scenario. (Nitrate loading rates were specified using metric units [kilograms per day] in the NLMM and these units are used in the following description of the model for consistency.) To define decision variables, the study area was divided into 97 management areas. The basic unit for the management areas was a 160-acre area (quarter-section) based on the Public Land Survey System. With the goal of making the base scenario loading in each management area approximately equal, as many as four quarter-sections (640 acres) were combined to form management areas in areas with lower lot density. The average number of lots in each management area was approximately 100 (fig. 19). The model had 194 decision variables, NRi,j, because two decision variables were defined for each management area: loading reduction (kilograms per day, kg/d) for existing homes and loading reduction for future homes. About 350 homes and lots were not included in the NLMM because they were in low density areas. These homes and lots represented only 7 kg/d of the total base scenario loading.
The objective function of the NLMM was to minimize the reduction in loading (from the base scenario), and is given as
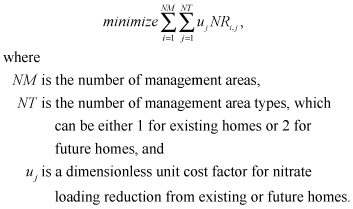 (1)
(1)
The value of the objective function was limited by a set of constraints on minimum reductions (relative to base scenario) in ground-water nitrate concentrations, minimum reductions (relative to base scenario) in ground-water discharge nitrate loading to streams, and minimum and maximum loading reductions to the aquifer for existing and future homes in each management area.
Minimum reductions in ground-water nitrate concentration constraints were set at 339 locations in the simulation model. The minimum reduction values were determined by simulating the base scenario equilibrium concentration at each location and computing the reduction necessary to meet a specified concentration value. For example, if the base scenario nitrate concentration were calculated by the simulation model to be 23 mg N/L and the maximum allowable concentration was 7 mg N/L, then the minimum reduction constraint at that location would be 16 mg N/L.
Constraints were set at one or two locations in the simulation model for each management area. One point was selected to be sensitive to loading from existing homes and another point was selected to be sensitive to loading from future homes in the management area. The most sensitive locations for existing and future loading were determined by simulating loading only from existing or future homes in a management area and determining the location (cell) in the model where the highest simulated concentrations occurred. If the same location were most sensitive to both existing and future loading from a management area, then only one location was set for that management area.
The model simulates three-dimensional flow and transport; therefore, nitrate concentrations can vary with depth. To account for the variation in concentration with depth, shallow and deep constraints were specified at most locations. The shallow constraint was specified 5–10 ft below the water table (an average of 20 ft below land surface) and the deep constraint was specified immediately above the suboxic boundary (an average of 50 ft below land surface). Four unique constraints (one shallow and one deep for both existing and future homes) specified in each management area for each of the 194 locations where concentration was constrained would have required specified constraints in 388 model cells. However, forty-nine locations were eliminated because the same location was sensitive to loading from both existing and future homes, and some cells were eliminated because the oxic ground-water layer was only two cells thick and only one cell was used. In all, there were 339 concentration constraint cells at 174 locations in the NLMM (fig. 19).
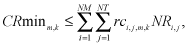
Mathematically, the minimum ground-water concentration reduction constraints were specified as
The minimum concentration reduction was computed as
CRminm,k = Csqm,k – Cmaxk, (2a)
The effect of loading from the 350 homes and lots not included in the NLMM was accounted for by simulating equilibrium concentrations throughout the model that resulted from base scenario loading at these 350 locations. The resulting concentrations at each constraint site were used to adjust the CRminm,k values at each site.
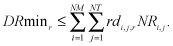
The simulation model results indicated that nitrate from on-site wastewater systems can reach streams through ground-water discharge. Because the addition of nitrate to streams could have a deleterious effect on stream quality, the NLMM was configured to allow constraints on the amount of nitrate discharged to streams. Constraints on minimum reduction in discharge of nitrate from ground water to streams were specified for 14 reaches on the Deschutes and Little Deschutes Rivers. The minimum reduction values were determined by simulating the base scenario equilibrium ground-water discharge nitrate loading to each reach and computing the reduction necessary to meet a specified discharge constraint. For example, if the base scenario ground-water discharge of nitrate to a reach was determined to be 3 kg/d and the specified discharge constraint (maximum allowable discharge of nitrate) was 1 kg/d, then the minimum reduction for that reach would be 2 kg/d. Mathematically, the minimum reduction in ground-water discharge nitrate loading to stream constraints were specified as
The minimum discharge loading reduction was computed as
DRminr = Dsqr – Dmaxr (3a)
Minimum and maximum nitrate loading reduction constraints were specified in the NLMM. Mathematically the constraints were expressed as
where NRminj andNRmaxj are minimum and maximum loading reduction constraints for existing (j=1) and future (j=2) homes (units of kg/d). The loading reduction constraints establish minimum or maximum loading reduction constraints on either existing or future homes.
The optimization method used to solve the NLMM is based on a widely applied technique for solving ground-water management problems called the response-matrix technique. The assumption that must be satisfied to use this technique is that the nitrate concentrations at each constraint site are a linear function of the loading rates in each management area. By assuming linearity, determining the nitrate concentration or ground-water discharge loading rate to streams is possible at any location where a constraint is specified by summing the contribution of loading in each management area to the concentration or discharge at that location. The response-matrix technique is described in detail by Gorelick and others (1993) and Ahlfeld and Mulligan (2000). The response-matrix approach has been used to solve ground-water waste-management problems similar to the problem evaluated in this work by Moosburner and Wood (1980), Gorelick (1982), and Gorelick and Remson (1982).
The assumption that simulated nitrate concentration and discharge nitrate loading to streams is a linear function of loading to the aquifer was tested through a series of simulations. The loading rate to a single management area was varied in each simulation and the computed nitrate concentrations at several constraint locations (model cells) were recorded. When loading rate was plotted against concentration for each location, the relation was shown to be linear.
One requirement of this technique is that the effect of the sources of nitrate loading on the ground-water velocity field is known because the mass loading of nitrate is the product of the nitrate concentration and hydraulic loading rate of the on-site wastewater systems. Previous workers have assumed that for concentrated pollutant sources, the source-water flow rate (hydraulic loading rate) has a negligible influence on the ground-water velocity field (Gorelick, 1982; Gorelick and Remson, 1982). This also is the assumption used for this study, where recharge from on-site wastewater systems to, and domestic water-supply well withdrawals from, the shallow aquifer are nearly equal, and both are small relative to natural recharge rates. Therefore, the ground-water velocity field without the influence of on-site wastewater systems as sources of recharge was used to simulate transport.
Use of the response-matrix technique requires that response functions for ground-water nitrate concentrations and ground-water discharge of nitrate to streams are calculated at each of the 339 model cells where concentration constraints were specified and the 14 stream reaches where ground-water discharge of nitrate was constrained. The response functions were calculated by making 194 simulations, one for each decision variable (97 management areas, each with decision variables for loading reduction for existing and future homes). The response to base scenario loading from either existing or future homes in a single management area was simulated. The spatial distribution of loading within each management area was at the resolution of a model cell—500 ft in the x- and y- dimensions. The purpose of these simulations was to compute the change in concentration at each constraint location caused by a unit change in loading at the location represented by the decisions variable. Calculation of the unit change in concentration was made using initial nitrate concentrations of zero and simulating equilibrium concentrations. The base scenario loading rates (kg/d) for existing and future homes in management area i and type j were defined as Nsqi,j. Concentration response coefficients, rci,j,m,k, were computed as
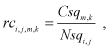 (5)
(5)
Ground-water discharge nitrate loading response coefficients, rdi,j,r, for each stream reach were computed as
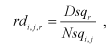 (6)
(6)
Units of milligrams per liter per kilogram per day were used for concentration response coefficients and ground-water discharge nitrate to stream response coefficients are dimensionless. The magnitude of the response coefficient is directly proportional to the sensitivity of the nitrate concentration or discharge nitrate loading at a constraint site to loading in a management area. This relation is illustrated for the concentration constraint site 31-E-S (fig. 20), which is the shallow concentration constraint site selected for its sensitivity to loading from existing homes in management area 31.
Management area 31 is adjacent to the west bank of the Little Deschutes River, approximately 1 to 1.5 mi north of Burgess Road (fig. 20). The linear response coefficients, rci,j,k,m, for several nearby management areas and types of homes (existing or future), show that loading in management areas 31, 32, 50, 51, 52, and 53 significantly affect the nitrate concentration at constraint location 31-E-S (table 7). Management areas 48, 49, 63, and 64 have lesser effects. Response coefficient values (table 8) indicate that the nitrate concentration at site 31-E-S is not a simple function of the number of homes in management area 31 or the distance from the site to adjacent management areas. Table 8 shows that the largest influence on concentration at point 31-E-S is from future homes in area 31, followed by existing homes in areas 31 and 50, future homes in areas 50 and 51, and existing homes in area 51. Response coefficients indicate that management area 32, the closest area to site 31-E-S, has less influence on concentration than more distant areas because of the direction of ground-water flow through the area (toward the Little Deschutes River) and the location of site 31-E-S in relation to homes in area 32.
Assuming the system is linear, the reduction in nitrate concentration, CRm,k , at constraint location m and depth k can be calculated with the concentration response coefficients by summation of the individual concentration reductions caused by reductions in loading to existing and future homes in each management area. The summation is written as
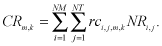 (7)
(7)
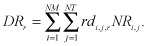
Similarly, the reduction in ground-water discharge nitrate loading to streams, DRr, can be calculated with the discharge loading response coefficients by summation of the individual discharge loading reductions caused by reductions in loading to existing and future homes in each management area. The summation is written as
 (8)
(8)
These summations include 194 terms because there are 97 management areas (NM) and 2 loading types (NT), existing and future homes, in each management area. In each summation, however, many terms are equal to zero because the response coefficients are zero; this occurs when concentration or discharge loading at a constraint location does not affect loading in a management area.
The response matrix was prepared by running one simulation for each decision variable in which loading was applied only at the locations defined for that decision variable (for example, existing homes in management area 31). The loading rate and resulting concentrations at each of the constraint locations were used to compute the response coefficient at each constraint location using equations 5 and 6. A set of utility programs and scripts were developed to run the 194 simulations, extract the simulated concentration values at constraint sites, compute the response coefficients, and format the coefficients into a matrix for input to the optimization program.
Response coefficients are the link between the simulation model and the NLMM. The response coefficients are utilized by the NLMM by replacing CRm,k (equation 2) with the right-hand side of equation 7 and replacing DRr (equation 3) with the right hand side of equation 8. The constraints for reduction in nitrate concentration and discharge loading to streams are then written as
 (9)
(9)
and
 (10)
(10)
Equations 9 and 10 replace equations 2 and 3 in the NLMM.
The modified NLMM, defined by equations 1 (objective function), 4 (loading constraints), 9 (concentration constraints), and 10 (discharge loading constraints), constitutes a linear program. This program was solved using the “What’s Best!” optimization program (LINDO Systems, 2003). This set of solvers is implemented as an add-in to Microsoft Excel. The response matrix and constraint definitions are defined in the spreadsheet using special functions provided in the “What’s Best!” add-in. The NLMM can mathematically search for the minimum nitrate loading reductions for existing and future homes in each management area that satisfy the constraints on nitrate concentrations in ground water and ground-water discharge loading of nitrate to streams. The program also identifies management problems that are not feasible. This occurs when at least one constraint cannot be met with any combination of decision variable values.
In the application of the La Pine NLMM described here, the values of constraints were varied in a sensitivity analysis to explore relations between constraint values and optimal loading rates to the aquifer. The three constraint options used in the NLMM were varied and optimal solutions were computed to demonstrate how decision makers might use the model in a trade-off analysis to determine the effect of constraint values on the objective of minimizing nitrate loading reductions. The NLMM also was used to evaluate the influence of a cost variable that accounts for differential costs in reducing nitrate loading from existing and future homes.
Ground-water concentration constraints were specified at as many as two locations for each management area: one location was the most sensitive to loading from existing homes in that management area, and one location was most sensitive to loading from future homes. In 20 management areas, the same location was most sensitive for both existing and future homes. A shallow constraint was specified near the water table at each these 174 locations (fig. 19). In addition, where the oxic part of the aquifer was greater than 10-ft thick (163 locations), a deep constraint was specified. As described in the discussion of the model formulation, the concentration constraint values, CRminm,k, were computed (equation 2a) as the minimum reduction from base scenario concentration that would be required to meet a specified concentration limit, Cmaxk.
Concentration constraints were varied to show the relative sensitivity of optimal loading solutions to constraints in different parts of the aquifer system. The total nitrate loading for existing and future homes in all 97 management areas was summed for each optimal solution to provide a basis for comparing the sensitivity of the solutions to values of the concentration constraints. The NLMM was solved using a range of 1 to 25 mg N/L for the maximum allowable concentration values for both the shallow (Cmaxs) and deep (Cmaxd) constraint locations. This range was selected because it includes most of the range of values that would constrain, or bind, the optimal solution. Binding constraints limit the amount of loading to the aquifer. Nonbinding constraints do not limit the loading to the aquifer system, because of their value or location.
The NLMM was used to compute optimal nitrate loading rates for various combinations of shallow and deep concentration constraints (fig. 21). Optimal solutions were most sensitive to concentration constraints in the shallow part of the ground-water system. This result was expected because concentrations are greatest at the water table where loading occurs, and decrease with depth and distance downgradient from the source. The base scenario loading used in the NLMM was 190 kg/d (153,000 lb/yr) and, as expected, this is the optimal loading solution for the case where there are no constraints specified. Curve A (fig. 21) shows the effect on optimal loading when concentrations are constrained only in the deep part of the system. Deep constraints do not limit optimal loading until constraint values are less than 10 mg N/L (point C, fig. 21). Specifying a nitrate concentration constraint of 1 mg N/L in the deep part of the aquifer limited optimal loading to 110 kg/d (point D). Curve B shows the effect on optimal loading when concentrations are constrained only in the shallow part of the system. Shallow constraints limit optimal loading throughout the range, with loading limited to 17 kg/d at a constraint value of 1 mg N/L (point E) and 168 kg/d at a constraint value of 25 mg N/L (point F). If a regulatory limit, such as the ODEQ “action level” of 7 mg N/L is applied to the shallow constraints (and no deep constraints are specified), optimal loading is reduced to 84 kg/d (point G)—a 56 percent reduction from base scenario loading. For comparison, if no shallow constraints are specified and 7 mg N/L is applied to the deep constraints, optimal loading is reduced very little, to 183 kg/d (point H). Loading sensitivity curves also are shown in figure 21 for shallow concentration constraint (Cmaxs) values of 5, 10, 15, 20, and 25 mg N/L; these curves were constructed by keeping the shallow constraint constant at the indicated value and varying the value of the deep constraint. For example, with shallow and deep constraints of 5 and 15 mg N/L respectively (point I), the optimal loading is 65 kg/d. For reference, the optimal loading for shallow and deep concentration constraints of 7 and 3 mg N/L, respectively, is 84 kg/d and plots at point J in figure 21. The effects of more- or less-stringent concentration constraints on nitrate loading in the shallow and deep parts of the ground-water system can be analyzed using figure 21.
These results can be used to assess trade-offs in protection of water quality in the shallow and deep parts of the aquifer. Few wells in the La Pine area are open to the upper 10 ft of the aquifer where the shallow constraints are specified. Using these results, decision makers could evaluate the cost, in terms of reduced loading, of protecting the shallowest part of the system (within 10 ft of the water table) to the same degree as the deeper part of the system (30–50 below the water table), where most domestic wells obtain water.
Fourteen stream reaches were defined where constraints could be applied to ground-water nitrate discharge loading. As described in the discussion of the model formulation, the discharge loading constraint values, DRminr, were computed (equation 3a) as the minimum reduction from base scenario discharge loading that would be required to meet a specified limit, Dmaxr. The beginning and end of each reach were selected to coincide with confluences or road crossings.
The purpose of this analysis was to demonstrate how the NLMM can be used to conjunctively manage water quality of ground-water and surface-water resources using optimization techniques. Discharge loading constraints were specified by setting a minimum percent reduction from base scenario ground-water discharge loading to streams. To determine the sensitivity to discharge loading constraints, the percent reduction was varied from 0 to 99 percent. Two sets of solutions were computed with NLMM: 1) with no constraints on ground-water concentrations, and 2) with shallow and deep ground-water concentration constraints of 7 and 3 mg N/L. Without concentration constraints, the discharge loading constraint directly limited the loading to streams as would be expected based on the formulation of the model (fig. 22). However, with the limitations imposed on loading by concentration constraints (7 and 3 mg N/L), discharge loading constraints had no effect on loading to streams until the constraint values were greater than about 50 percent reduction (fig. 22). At values greater than 50 percent, most loading reductions required to meet this constraint are needed in the management areas adjacent to streams, where, according to simulation results, shallow ground-water flow paths through the thin oxic part of the ground-water system are connected to the streams. With no concentration constraints and discharge loading to streams constrained to a minimum reduction of 97 percent, the total loading to the system is about 100 kg/d. By comparison, constraining concentration to 7 and 3 mg N/L (shallow and deep, respectively) and constraining discharge loading reduction to at least 97 percent requires that total loading be reduced to about 40 kg/d (fig. 22). The additional reduction in total loading required to meet the ground-water concentration constraints, 60 kg/d, reflects the additional costs of management strategies designed to protect both ground‑water quality and stream quality.
These results can be used to assess trade-offs in the protection of surface-water quality. To make decisions on the values of discharge constraints, the processes affecting nitrate as it is transported through the near stream and riparian environments need to be better understood (Hinkle and others, 2007b). The simulation model uses simple assumptions regarding the fate and transport of nitrate in this part of the ground-water system and the estimates of ground-water discharge of nitrate to streams should be considered the upper limits of possible discharge.
Minimum and maximum loading reduction constraints, NRmin and NRmaxin equation 4, can be specified for existing or future homes in the NLMM. The constraints are computed as a percentage of the base scenario loading for the existing or future homes in each management area. For example, if base scenario loading for future homes in a management area is 2 kg/d, and the desired loading reduction is a minimum of 25 percent of status-quo build-out loading, then NRmin would be equal to 0.5 kg/d.
In this example, the loading constraints were used to evaluate how specifying minimum nitrate reduction standards for future homes would affect the overall loading and the proportion of loading from existing homes. As formulated, the NLMM also offers the ability to specify other constraints on loading reduction, such as maximum loading reduction for either future of existing homes. This type of constraint could be used to reflect the limitations of alternative treatment systems to reduce loading by more than a specified percentage.
Optimal solutions were computed in which the minimum reduction constraint for future homes varied and all other constraints were constant. Ground-water concentration constraints of 7 and 3 mg N/L were specified for the shallow and deep sites, respectively, and ground-water discharge nitrate loading to streams was unconstrained. All existing on-site wastewater systems in the study area are assumed to discharge effluent with 46 mg N/L nitrate, and this was the performance level used to compute the base scenario loading of 190 kg/d. Maximum loading reduction constraints were 96 percent of base scenario loading for both existing and future homes; this constraint reflects the assumption that the best attainable on-site wastewater system performance is 2 mg N/L. The minimum loading reduction constraint for future homes was specified on the basis of assumed performance standards for on-site wastewater systems that ranged from 2 to 46 mg N/L concentration in effluent that recharged the ground-water system. Thus, in this series of solutions, the 46 mg N/L performance level was the equivalent of zero reduction from base scenario loading. The other performance levels used were 2, 10, 20, and 30 mg N/L, corresponding to minimum loading reductions of 96, 78, 57, and 35 percent, respectively (fig. 23).
Under base scenario conditions, existing and future homes will contribute 104 and 86 kg/d, respectively, to the total loading of 190 kg/d. The results of this analysis show that as the minimum loading reduction constraint for future homes is increased from 0 to 96 percent, optimal loading from future homes decreases from 38 to 3 kg/d and the associated total loading decreases from 84 to 58 kg/d.
The reduction in loading to the aquifer from future homes implemented using a minimum reduction constraint allows higher loading rates to be maintained from existing homes while still meeting concentration constraints. If no loading reduction is required for future homes, loading from existing homes will have to be reduced by 56 percent (from 104 to 46 kg/d). By requiring improved performance of on-site wastewater systems in future homes, there is less need for loading reduction from existing homes. For example, if a 96 percent reduction requirement is imposed for future homes, loading from existing homes would have to be reduced by only 47 percent to meet ground-water concentration constraints of 7 and 3 mg N/L for shallow and deep parts of the aquifer. If it were less costly to reduce loading from future homes by installing advanced treatment on-site wastewater systems than requiring existing homes to be retrofitted with advanced treatment on-site wastewater systems, then using this type of constraint in the NLMM would allow planners to incorporate specific on-site wastewater system performance standards for future homes into the optimal solution.
The simulation model accounts for the physical and geochemical complexities of the ground-water system and this information is available to the NLMM through the response coefficients that were computed using the study area simulation model. Other variables (external to the simulation model) also can be important in determining the optimal nitrate loading solution. The cost of implementing management strategies is the most common external variable that affects management decisions. In many optimization problems, the objective is to minimize the cost of satisfying the constraints on the problem.
Reducing loading from on-site wastewater systems can incur significant costs whether by limiting housing density or installing and maintaining advanced treatment on-site wastewater systems. The cost factor of reducing nitrate loading, uj in equation 1 of the NLMM, can be used to account for differences in cost for existing and future homes. If the cost of nitrate reduction varies among decision variables in other ways, such as geographically, cost variables can be specified for individual management areas.
The sensitivity of the La Pine NLMM to differences in the cost of reducing nitrate loading from existing and future homes was evaluated by computing the optimal loading solutions for a range of unit cost ratios. Arbitrary cost factors were specified that resulted in ratios of existing to future unit costs ranging from 0.11 (1:9) to 9.0 (9:1). For example, for a cost ratio of 0.11, the cost factors for existing and future loading reduction were 1 and 9, meaning that it was 9 times more costly to reduce nitrate loading from future homes. To define the extremes, two additional solutions were computed in which the unit cost was set to zero, first for existing, and then for future homes. The only constraints were ground-water concentration constraints of 7 and 3 mg N/L for the shallow and deep sites. The loading from existing and future homes for each cost ratio are shown in figure 24.
The highest optimal total loading (84 kg/d) occurs when the cost ratio (existing:future) is 1.0 (costs are equal). As the ratio increases or decreases to favor reductions in future or existing homes, respectively, the optimal balance in loading is affected because the objective function (to minimize cost) is most efficiently reduced by eliminating loading from homes that have the lowest cost per unit reduction. As the cost ratio increases or decreases from 1.0, the total loading that can be maintained decreases because cost variables now act as weighting factors that partially determine which management areas and home types will have reduced loading. It is not likely that the ratio of unit costs would fall outside the range of 0.43 to 2.33, within which the effect on total loading is relatively small. The relative contributions to loading from existing and future homes, however, do vary significantly within this range. This indicates that wherever possible, true cost factors should be incorporated into the NLMM to account for this important external variable.
The NLMM computes the minimum loading reduction needed from existing and future homes in each management area to achieve the water-quality goals prescribed by a constraint set. To illustrate the variation in optimal loading between management areas, optimal reductions in loading rates to each management area from both existing and future homes were mapped for a specific set of constraints. The constraints for this solution included (1) ground-water nitrate concentrations could not exceed 7 mg N/L at shallow locations and 3 mg N/L at deep locations, and (2) the maximum loading reduction possible for either existing or future homes was 96 percent. The ground-water concentration limits were selected to reflect the goals of minimizing loading reductions and insuring protection of the part of the aquifer (30 to 50 ft below the water table) where most domestic wells obtain water. The 96 percent limit on loading reduction is consistent with data from the La Pine NDP that show that the best-performing advanced treatment on-site wastewater systems tested are capable of reducing nitrogen to about 2 mg N/L as nitrate in effluent leaving the drain field. No constraints were placed on discharge of nitrate to streams or minimum loading reduction and no differential cost factors were included.
The optimal minimum reductions vary over a broad range in the 97 management areas. The breadth of the range is a reflection of the complex relations between development location and density, hydrogeology, and geochemical processes. For the specified constraints, the optimal reduction in total loading is 107 kg/d, or 56 percent of the 190 kg/d of loading projected for the base scenario. Contributions to build-out loading were reduced from 104 to 46 kg/d for existing homes and from 86 to 38 kg/d for future homes. The optimal reductions in each management area for existing and future homes are shown in figures 25 and 26, respectively.
Overall, the loading from existing homes was reduced by the same proportion, 56 percent, as the loading from future homes because there was roughly the same number of existing and future homes (undeveloped lots) in 2000. Locally, the reductions in loading from existing and future homes for individual management areas often were quite different. For example, in management area 33, where most lots had been developed by 2000, loading from existing homes and future homes would need to be reduced by 81 and 67 percent, respectively (figs. 25, 26). Even fewer undeveloped lots were in the adjacent management area 34 and the entire loading reduction needed to meet concentration constraints (93 percent) would need to come from existing homes.
To further validate the assumption that the simulated nitrate concentrations and ground-water discharge nitrate loading to streams were linear functions of nitrate loading to the aquifer, the base scenario loading (scenario 1) was reduced in each management area by the percentages computed using the NLMM (figs. 25, 26). This loading was used as input to the study-area simulation model and the equilibrium nitrate concentrations and discharge loading to streams simulated by the study-area model were compared to the values computed by the NLMM at the 339 concentration and 14 discharge loading constraint locations and reaches. The simulated concentrations and discharge loading were equal to the values computed by the NLMM using the response coefficients at all constraint locations and reaches. The detailed spatial distribution of loading reduction illustrated in this example could be used by decision makers to delineate ground-water protection zones and set performance standards for on-site wastewater systems to achieve the needed loading reductions.
Simulated ground-water nitrate concentrations were used to compare the results of the scenario simulations with the results of an optimal solution computed using the NLMM. For the comparison, concentration values were compiled at the 339 NLMM constraint locations (fig. 19) for four of the scenarios simulated using the simulation model in a “trial-and-error” mode. The four scenarios (1, 3, 5, and 7 in table 6) specified on-site wastewater concentrations at the water table of 46, 20, 10, and 2 mg N/L, respectively. For this analysis, a fifth scenario using a wastewater concentration of 30 mg N/L also was simulated. Scenario 1 was the base scenario where conventional on-site wastewater systems yield 46 mg N/L nitrate at the water table. The other four scenarios are based on the assumption that all existing and future homes would install advanced treatment on-site wastewater systems that reduce loading to the same standard. The optimal solution used in the comparison is that in which ground-water nitrate concentrations could not exceed 7 mg N/L at shallow sites and 3 mg N/L at deep sites, and the maximum loading reduction possible for either existing or future homes was 96 percent.
The relative effectiveness of the management alternatives used in each scenario was evaluated by comparing water-quality improvements (as measured by the percentage of constraint locations with nitrate concentrations greater than 7 mg N/L) with reduced loading for the scenarios and the optimal solution (fig. 27). The base scenario (no loading reduction) resulted in equilibrium concentrations greater than 7 mg N/L for 46 percent of the constraint locations. Using advanced treatment systems that can produce nitrate concentrations of 30, 20, 10, and 2 mg N/L, reduced loading by 35, 57, 78, and 96 percent and reduced the fraction of constraint locations where ground-water concentrations exceeded 7 mg N/L to 36, 26, 8, and 1 percent, respectively.
The optimal solution would reduce total loading by 56 percent, and yet had only 3 constraint locations (<1 percent) with concentrations greater than 7 mg N/L. These three locations were affected by a small amount of unmanaged loading from dispersed homes not included in the NLMM. Loading reduction for the optimal solution was 106 kg/d, which was nearly equivalent to the loading reduction in the 20 mg N/L scenario (3), in which 26 percent of the sites had concentrations greater than 7 mg N/L. The 10 mg N/L and 2 mg N/L scenarios (5 and 7, respectively) are approximately equivalent to the optimal solution in reducing nitrate concentrations in ground water. Because they apply uniform management strategies, however, loading must be reduced by 40–69 percent more than would be required under the optimal solution to achieve similar results.
The scenarios are based on uniform management strategies (for example, all new homes have advanced treatment on-site wastewater systems and all existing systems are replaced), whereas the optimal solution implements loading reductions only where reductions are needed to meet quality constraints. Decision makers would unlikely be able to implement the optimal solution exactly because it would be difficult to have variable on-site wastewater system performance requirements across management areas as small as those defined in the NLMM. More likely, decentralized wastewater treatment would be managed over larger areas that have similar nitrate loading capacity in the NLMM solution. This approach could increase the overall loading reduction required to meet water-quality standards, but still be less costly than uniform management strategies.

![]() U.S. Department of the Interior | U.S. Geological Survey
U.S. Department of the Interior | U.S. Geological Survey
URL: https://pubs.usgs.gov/sir/2007/5237
Page Contact Information: Publications Team
Page Last Modified: Thursday, 01-Dec-2016 19:54:16 EST
