Scientific Investigations Report 2008–5027
U.S. GEOLOGICAL SURVEY
Scientific Investigations Report 2008–5027
Sample Collection—Depth- and width-integrated water samples were collected at stream sites using a DH-81 hand sampler with cap and nozzle assembly attached to a 1–3 liter (L) Teflon® bottle (Edwards and Glysson, 1999), or if depths were shallow, by compositing width-integrated, hand-dipped samples into 1-L baked amber glass bottles, and composited into 3-L Teflon® bottles. During the 2005 storm synoptic samplings, width-integrated samples were sometimes collected in well-mixed streams using a large (15–18 L) glass carboy. Some of these samples were processed through a Teflon® churn splitter to produce split samples for the Oregon Department of Environmental Quality laboratory for analysis of select organophosphate, triazine, and pyrethroid pesticides in unfiltered water. These data are not included in this report.
Source and finished drinking-water samples were collected using trace-level (parts-per-billion) protocols developed by the NAWQA Program for dissolved pesticides (Wilde and others, 2004). Samples were collected from the drinking-water treatment plant taps into either a 14-L Teflon® churn splitter or 20-L glass carboy. With minor variation, finished samples were collected approximately 90 minutes after source water samples to approximate travel time through the water-treatment plant. Samples were placed into clean plastic cans, packed in ice, and transported to the Oregon Water Science Center laboratory in Portland, Oregon, for processing. Streamflow was measured according to standard USGS guidelines (Rantz and others, 1982), and continuous streamflow was obtained from the USGS streamflow-gaging stations in the lower Clackamas River at Estacada and near Oregon City.
Data Quality Control—About 20 percent of the water samples were submitted for quality control (QC). For pesticides, this included 15 field equipment blanks and 1 laboratory blank sample submitted to check for potential contamination in the sampling, processing, and laboratory analysis. Eleven replicate (split) samples were collected to check laboratory variability, and seven native stream and organic-free blank water samples were “spiked” with known additions of pesticides to measure the analytical accuracy of the reported concentrations, expressed as a percentage of individual compound recoveries. In addition, all pesticide samples (QC and regular samples) received synthetic tracer compounds (surrogate spikes) to track their recovery during analysis.
An evaluation of results for QC samples is presented in appendix A. In summary, all pesticide blank samples were free of pesticides, indicating a very low potential for false positives to occur for pesticides in the samples collected for the current study. Replicate QC samples showed good reproducibility in analytical results for concentrations in most cases. All pesticide concentration data used in this report can be obtained from the Clackamas River Basin Water-Quality Assessment Web page, http://or.water.usgs.gov/clackamas/. The source and finished water data from the SWQA study are published in Carter and others (2007).
Water samples for pesticides were filtered through 0.7-µm baked glass-fiber (GF) filters into 1-L baked amber glass bottles. An ascorbic-acid based dechlorinating powder (quenching agent) was added to samples of finished drinking water in 2004 and 2005 to remove the chlorine from the samples (Mark Sandstrom, U.S. Geological Survey, oral commun., 2006). Water samples collected from the tributaries and the Clackamas River, including the source water samples collected at the water-treatment plant, were not chlorinated and did not receive the dechlorinating powder.
Water samples were shipped to the USGS National Water Quality Laboratory in Denver, Colorado, where they were analyzed for between 86 and 198 pesticides and degradates, depending on the individual study, using a C-18 solid phase extraction, gas chromatography/mass spectrometry (GC/MS) method (Zaugg and others, 1995; Lindley and others, 1996; Furlong and others, 2001). These laboratory methods are able to detect organic contaminants at trace concentrations (parts-per-billion, or lower), and are rigorously evaluated to establish detection limits based on statistical analysis of compound performance during analysis. When a pesticide is detected, there is a high degree of certainty (greater than 99 percent confidence) that the compound is present.
Pesticide detections occurring at concentrations less than assigned detection levels were quantified by the laboratory, but received an estimate code (remark code of “e”) qualifying the concentration in the USGS database. Values were coded “e” by the laboratory when (1) certain compounds had poor recoveries or were particularly difficult to analyze, (2) sample matrix effects from chemical mixtures in storm runoff, for example, resulted in analytical difficulties, or (3) concentrations were less than the laboratory reporting level (LRL), but higher than the method detection level (MDL). Concentrations less than the LRL (also called the quantitation level) are difficult to quantify but considered to be nonzero. The accuracy of these estimated values are statistically less than values that were not coded “e,” but the probability of a false positive is less than 1 percent whether values were coded “e” or not.
Differing suites (or schedules) of pesticides were analyzed in water samples collected during the different studies, depending on project goals, so interpretations regarding pesticide occurrence and distribution need to consider which pesticides were analyzed and when. Tributary samples collected during the four storm events in 2000 and 2005 were, for the most part, analyzed for a similar suite of pesticides and are relatively comparable. In 2000, storm samples were submitted for laboratory schedules 2010 and 2050, whereas schedules 2001 and 2060 (nearly identical suites of compounds) were used for the storm samples collected in 2005. These schedules cover 86 of the most commonly used pesticides in the United States. Samples collected for the USGS urbanization study were tested for a smaller subset of pesticides (about 65 pesticides and degradates) analyzed in schedule 2003. The SWQA samples were analyzed for about 130 pesticides in schedules 2003 and 2060. Pesticides and schedules in which they are included are presented in appendix B, table B1. During the May and September 2005 storm event samplings (only), glyphosate and two glyphosate degradates (AMPA and glufosinate) were analyzed. One herbicide (dichlobenil—the active ingredient in Casoron™) was detected at relatively high concentrations (8.0 and 16.8 μg/L) in Sieben Creek during 2000 (Carpenter, 2004), but laboratory analysis of dichlobenil was discontinued after 2001 because of difficulties associated with its analysis.
Turbidity data were collected from unfiltered grab samples collected during the May and September 2005 storm events, and from the continuous monitor operated by the USGS in the Clackamas River at river mile 1.3 near Oregon City. The grab samples were analyzed at the USGS Oregon Water Science Center laboratory with a Hach 2001N benchtop turbidity analyzer, which reports in Nephelometric Turbidity Ratio Units (NTRUs). The continuous water-quality monitor reports turbidity in Formazin Nephelometric Units (FNUs), which are comparable (not identical) to NTRUs. The continuous monitor data, related reports, and other data are available on the project Web page, http://or.water.usgs.gov/clackamas/.
Land-cover data were derived for each sampling site from 30-meter resolution satellite data collected in 2001: USGS National Land Cover Data (NLCD01) (U.S. Geological Survey, 2005). The NLCD01 for Clackamas County was modified from the Coastal Change Analysis Program data (National Oceanic and Atmospheric Administration, 2005) by adjusting to match the USGS protocols and classification scheme to be consistent with NLCD01 datasets for other parts of the country. These land-cover data represent the Anderson Level II classification scheme (Anderson and others, 1976). Land-cover values for each site/basin (table 1) were tabulated using Geographic Information System (GIS) Spatial Analyst Tools extension software in Arc GIS, version 9.1, Environmental Systems Research Institute (ESRI).
A screening-level assessment was conducted to evaluate the concentrations of pesticides detected in the tributaries and mainstem Clackamas River, and in finished drinking water, to aquatic-life and human-health benchmarks, respectively. Pesticide concentrations in the tributaries and mainstem Clackamas River were compared with aquatic-life benchmarks from the USEPA Office of Water, USEPA Office of Pesticide Programs, State of Oregon Department of Environmental Quality, and other agencies, such as the National Academy of Sciences/National Academy of Engineering (NAS/NAE) and the Canadian Council of Ministers of the Environment (CCME). Pesticide concentrations in finished drinking water were compared to human-health benchmarks, such as USEPA Maximum Contaminant Levels (MCLs) or, for unregulated compounds, to newly established Health-Based Screening Levels (HBSLs), when available. These human-health benchmarks were developed to evaluate long-term concentrations, not the instantaneous pesticide concentrations measured during the study.
HBSLs are nonregulatory benchmarks that may indicate a potential concern for human health when concentrations exceed benchmarks (Toccalino and others, 2006). HBSLs were developed by the USGS in collaboration with the USEPA, the Oregon Health and Science University, and the New Jersey Department of Environmental Protection for compounds without USEPA drinking-water standards. HBSLs for unregulated contaminants are calculated using (a) standard USEPA Office of Water (OW) equations for establishing drinking-water guideline values (Lifetime Health Advisory (HA–L) and Cancer Risk Concentration values) for the protection of human health and (b) the most current USEPA peer-reviewed, publicly available human-health toxicity information (Toccalino and others, 2003; Toccalino, 2007). For noncarcinogens, the HBSL represents the contaminant concentration in drinking water that is not expected to cause adverse effects over a lifetime of exposure. For carcinogens, the HBSL range represents the contaminant concentration in drinking water that corresponds to an excess estimated lifetime cancer risk of 1 chance in 1 million (low HBSL) to 1 chance in 10,000 (high HBSL). HBSL calculations adopt USEPA assumptions for establishing drinking-water guidelines, namely, lifetime ingestion of 2 L of water per day by a 70-kilogram adult. For noncarcinogens, 20 percent of the total contaminant exposure is assumed to come from drinking-water sources, and 80 percent is assumed to come from other sources (for example, food and air). If data are available to quantify the percentage of contaminant exposure that comes from water, then a data-derived percentage is used instead of the default of 20 percent (Toccalino and others, 2006).
Because HBSLs are calculated using USEPA cancer classifications, USEPA toxicity data, and standard OW equations for establishing drinking-water guideline values, HBSLs are equivalent to existing USEPA Cancer Risk Concentration and HA–L values (when they exist), except for compounds for which more recent toxicity information has become available (Toccalino, 2007). The screening-level assessment used in this study was intended to identify pesticides that may be of potential concern or to prioritize needs for further investigation. Screening-level assessments are not designed to evaluate specific effects of contaminants on human health, and are not a substitute for comprehensive risk assessments, which generally include many additional factors, including multiple avenues of exposure (Toccalino and others, 2006). The USGS and its partners are continuing to refine the HBSL methodology—additional information about HBSLs and ongoing research is available at http://infotrek.er.usgs.gov/traverse/f?p=HBSL:HOME:3987754988573050.
In this report, contaminant concentrations were evaluated using maximum Benchmark Quotients (BQ max) values—ratios of the maximum measured contaminant concentrations detected to benchmark values, such as drinking water MCLs, HBSL, or aquatic-life benchmarks. The benchmark quotient ratios provide a way of evaluating the relative toxicity for each of the detections because it normalizes individual pesticide concentrations to their benchmarks. This approach does not, however, consider the potentially additive or synergistic effects of exposure to multiple compounds.
To address the issue of evaluating the potentially cumulative effects of multiple pesticide exposure on aquatic life, an additive model called the Pesticide Toxicity Index (PTI) developed by Munn and Gilliom (2001) and refined by Munn and others (2006) was used. The PTI provides an indication of the potential toxicity of a sample by adding individual toxicity quotients for pesticides detected in a sample, and although the PTI does not determine whether water in a sample is toxic, the values can be used to rank or compare the toxicity of samples on a relative basis. The PTI approach may be useful as a basis for comparing the significance of pesticides in different streams on a common basis, for evaluating relations between pesticide exposure and observed biological conditions, and for prioritizing future studies.
The PTI was calculated as the sum of the toxicity quotients for each pesticide detected in a sample, or the concentration divided by the median toxicity endpoint, typically an LC50 (the lethal concentration for 50 percent of a test population) for a 96-hour chemical exposure:
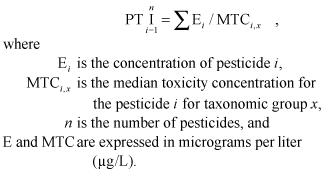 (1)
(1)

![]() U.S. Department of the Interior | U.S. Geological Survey
U.S. Department of the Interior | U.S. Geological Survey
URL: http://pubs.usgs.gov/sir/2008/5027
Page Contact Information: Publications Team
Page Last Modified: Thursday, 10-Jan-2013 18:43:05 EST
