Scientific Investigations Report 2008–5126
U.S. GEOLOGICAL SURVEY
Scientific Investigations Report 2008–5126
Historical flow data collected at continuous streamflow-gaging stations, sufficient in quality and quantity, are fundamental to the accurate calculation of flow statistics. All data used to compute flow statistics in this study were from daily mean flow records at streamflow-gaging stations operated by the USGS or OWRD in Oregon and from streamflow-gaging stations operated by the USGS in the neighboring States of Washington, Idaho, Nevada, and California. Flow statistics based on daily flow data can be used as benchmarks for planners and water managers who may need to determine if streamflow will be sufficient for water-quality and aquatic habitat needs, or if streamflows will exceed the design capacity of a reservoir or a bridge.
Flow-duration data commonly are used to statistically characterize streamflow. Flow-duration data are daily mean flow values measured over a specified time interval that have been exceeded various percentages of the specified time interval. For example, a 5-percent exceedance probability represents a high flow that has been exceeded only 5-percent of all days of the flow record. Conversely, a 95-percent exceedance probability would characterize low-flow conditions in a stream, because 95 percent of all daily mean flows in the record are greater than that amount.
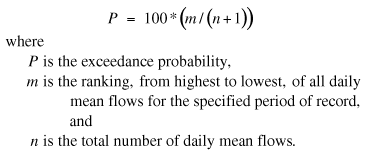
For flow-duration statistics to be reliable indicators of probable future conditions, a minimum of 10 years of record typically is used (Searcy, 1959). The equation used to compute the exceedance probability, which also is referred to as the flow-duration percentile, is given as:
 (1)
(1)
To determine the flow for a specific flow duration percentile, interpolation between the discharges associated with percentiles on either side of the specific percentile may be needed. Flows that are equal to each other also would be given separate m rank values. With the equation above, high flows are assigned low percentiles and low flows are assigned high percentiles. This is contrary to the computation of nonexceedance flow duration percentiles used in some statistical software packages, where high and low flows correspond to high and low percentiles, respectively.
The 7-day, 2-year (7Q2) and 10-year (7Q10) annual low-flow statistics are based on an annual series of the smallest values of mean discharge computed over any 7-consecutive days during the annual period. A probability distribution is fit to the annual series of 7-day minimums, and the 7Q2 statistic is the annual 7-day minimum flow with a 2-year recurrence interval (nonexceedance probability of 50 percent), although the 7Q10 statistic is the annual 7-day minimum flow with a 10-year recurrence interval (nonexceedance probability of 10 percent). Low-flow frequency also can be computed on a seasonal or monthly basis by limiting the daily data used for the annual series to just the season or month of interest. For example, the March 7Q2 and 7Q10 flow statistics are calculated by fitting a probability distribution to the annual series of 7-day minimums computed just from daily mean flows in March of every year.
The log-Pearson Type III probability distribution (U.S. Interagency Advisory Committee on Water Data, 1982), which typically is used for determining low-flow frequencies, was used for determining low-flow frequency for this study. An overview of techniques used to compute low-flow frequency statistics is provided by Riggs (1972), and more specific information about the log-Pearson Type III distribution can be found in a report by the U.S. Interagency Advisory Committee on Water Data (1982). The climatic year (April 1 to March 31) was used to define the starting and ending dates of annual periods for computation of the 7-day minimum flows. Although most annual 7-day low flows occur during the summer months, the annual 7-day low flow can sometimes occur in the winter during prolonged subfreezing periods at high-altitude streamflow-gaging stations. The annual 7-day low flows at some streamflow-gaging stations used in this study were equal to zero. A conditional probability adjustment for zero flow values (U.S. Interagency Advisory Committee on Water Data, 1982, appendix 5) was used for sites with one or more annual 7-day low-flow values of zero.
Although flow-duration and low-flow frequency statistics commonly are computed on an annual basis, they also can be computed on a seasonal or monthly basis. For example, the 7Q10 flow for March would be calculated using just daily mean flows for every March for the period of record.

![]() U.S. Department of the Interior | U.S. Geological Survey
U.S. Department of the Interior | U.S. Geological Survey
URL: http://pubs.usgs.gov/sir/2008/5126
Page Contact Information: Publications Team
Page Last Modified: Thursday, 10-Jan-2013 18:52:41 EST
