Scientific Investigations Report 2008–5169
U.S. GEOLOGICAL SURVEY
Scientific Investigations Report 2008–5169
Samples were selected primarily based on condition of the core as well as the representative nature of the material in the overall aquifer profile. Boreholes with available sediment included M1823, M2050a, M2051, and USGS133 (fig. 2). Most core samples were unlined; therefore, a technique was developed to create a liner and water-inflow reservoir as one composite unit that would prevent annular flow along the sample edge during the falling-head measurement of Ksat (fig. 3). The samples were first trimmed carefully using hand tools for determination of ρbulk where the sample volume must be known (ρbulk = mass of solid/total volume). High-density polyethylene liners, with a diameter several centimeters larger than the core samples, were cut to provide a 5–10 cm reservoir at the top of the sample. The core samples were placed within the prepared liners and the annular space was filled with a moderately viscous epoxy that could be poured easily, but that would minimally penetrate the sample pore spaces. Before assembly, the liners were abraded on the inner surfaces to ensure good adhesion with the epoxy. Samples used for Ksat measurement are listed in table 1 with a brief visual description.
The standard falling-head method for obtaining Ksat was used for most samples (Reynolds and others, 2002). For samples with low saturated conductivity, inferred a priori based on the time for the sample to saturate completely from the bottom up, a modification of the standard method was performed in a centrifuge with Ksat calculated using the following equation (Nimmo and Mello, 1991; Nimmo and others, 2002):
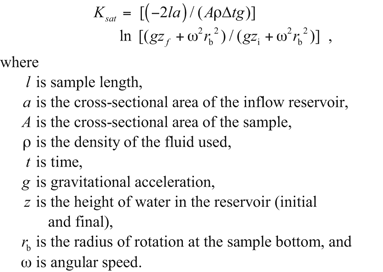 (1)
(1)
Errors in measured Ksat values commonly arise from annular flow between the sample and liner (which was eliminated by casting the samples with epoxy), mechanical error, precision of the device used to measure length, and operator error. The calculated maximum error in Ksat due to these effects is about 10 percent (Nimmo and others, 2002).
A Coulter LS-230 Particle Size Analyzerwas used to characterize particle-size distributions by optical diffraction (Gee and Or, 2002). The range of measurement for this particular device is 0.04–2,000 µm, which is divided into 116-µm size bins. Any particles greater than 2,000 µm were sieved out and later integrated into the size-distribution results. The fraction less than 2,000 µm was disaggregated carefully using a mortar and rubber-tipped pestle, and then split with a 16-compartment spinning riffler to obtain appropriate random samples for analysis. The material was sonicated in suspension for 60 seconds prior to each run; an average of two runs was calculated for each sample.
Two property-transfer models were evaluated in this study. Winfield (2005) formulated the following property-transfer equation for Ksatusing particle-size statistics [median particle diameter (d50) and uniformity coefficient (Cu)] and ρbulk as input:
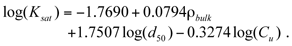 (2)
(2)
In an earlier study (Pudney, 1994), the following empirical relation was found between Ksat and ρbulk:
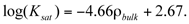 (3)
(3)
The root-mean-square error (RMSE), also referred to as the standard error of the estimate, is used in this study as a goodness-of-fit indicator between measured and estimated Ksat values. The RMSE is calculated as:
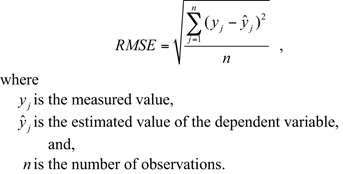 (4)
(4)
Small RMSE values indicate the estimated value is closer to the measured value of the variable. Ksat values span several orders of magnitude, thus, in effect, unequally weighting points in the RMSE calculation. Therefore, the Ksat values were transformed logarithmically prior to calculation.
The average error (AE) also was calculated for comparison to highlight systematic over or under prediction as follows:
 (5)
(5)
For the data analyzed here, a negative AE value indicates under estimation and a positive AE value indicates over estimation.

![]() U.S. Department of the Interior | U.S. Geological Survey
U.S. Department of the Interior | U.S. Geological Survey
URL: http://pubs.usgs.gov/sir/2008/5169
Page Contact Information: Publications Team
Page Last Modified: Thursday, 10-Jan-2013 18:55:03 EST
