Scientific Investigations Report 2009–5078
MethodsThe first year of the study (2004) was used to qualitatively and semiquantitatively characterize the aquatic plant conditions, geomorphology, and habitat in the lower 116 mi of the Yakima River, characterize the nutrient and suspended-sediment conditions, calculate a load balance for nutrients and suspended sediment, and begin to characterize the extent and severity of exceedences of the State water-quality standards. This accomplished the first and second study objectives and began work on the third objective. The results from the first year of study were used to divide the river into three reaches based on aquatic plant growth, physical characteristics, and water-quality conditions—the Zillah reach from RM 116 to RM 72, the Mabton reach from RM 72 to RM 47, and the Kiona reach from RM 47 to RM 4. During 2005–07, the aquatic plant conditions and the extent and severity of exceedences of the State water-quality standards in the three reaches were characterized in more detail (objective 3). The important factors related to the spatial and temporal patterns in aquatic plant and water-quality conditions (objective 4) were investigated by assessing each of the three reaches along with the lower Naches River, a major tributary that enters the Yakima River at RM 117. These targeted studies were done in representative sections of each reach and allowed us to quantify relations that might not have been apparent over the entire 116 mi of the lower Yakima River. The Naches River was included in 2007 to provide a comparison between periphyton growth in the Zillah reach with a river of similar discharge, but with lower nutrient concentrations. Because the study approach for each year was based on the findings of the preceding year, the overall study approach (appendix A (PDF, 128 KB)) was adaptive (especially related to objective 4). Building on the results from each year allowed the flexibility to attempt to answer questions of the most interest to water-quality managers and other stakeholders as the study progressed. Data CollectionData collection included an assessment of aquatic plant conditions (qualitative species composition and quantitative biomass for algae and macrophytes), geomorphology, and habitat; water-quality sampling for total and dissolved nitrogen and phosphorus; and continuous monitoring of field parameters (water temperature, specific conductance, dissolved oxygen, pH, turbidity, and total chlorophyll [Chl a]) (table 15; at back of report). Data collection typically began each year in March and continued into October, and included the high flow spring-runoff period and the relatively low flow summer and early autumn runoff period. Reach-scale surveys of aquatic plant growth were completed in the lower Yakima River during low flow periods in 2005, 2006, and 2007, when additional habitat data (water depth, velocity, and profiles of light penetration into the water column) also were collected. Assessment of Aquatic Plant Conditions, Geomorphology, and HabitatA survey for aquatic plant occurrence, geomorphology, and habitat (substrate type, water depth, and velocity) was done in the lower 116 mi of the Yakima River June 14–18, 2004, during abnormally low streamflow. The mean daily streamflow in the Yakima River at Kiona was 1,190–1,850 ft3/s during the assessment, which was well below the long-term mean of 5,238 ft3/s for June 14–18. Most of this assessment was done by boat or kayak, but a small section of the river was not navigable and was assessed by wading or from the river bank. All data collected during the June 2004 survey are available at http://or.water.usgs.gov/projs_dir/yakima_nutrients/ (U.S. Geological Survey, 2008). Measurements of water depth, velocity, and photosynthetically active radiation (to calculate light extinction coefficients) were made in 2005, 2006, and 2007 in support of targeted reach-scale studies (table 15). Water Sample Collection and Laboratory AnalysesA Lagrangian synoptic survey was performed during July 26–29, 2004, to investigate longitudinal water-quality conditions in the lower Yakima River. The synoptic sampling included 13 main stem sites on the Yakima River, the mouths of 15 tributaries, the outflow of 6 wastewater treatment plants that discharge directly to the Yakima River, 3 canal diversions, and 1 canal power plant return. The water-quality parameters measured included dissolved nitrite plus nitrate, dissolved ammonia, total Kjeldahl nitrogen (TKN), total phosphorus, dissolved orthophosphate, dissolved silica, suspended sediment, and Chl a. Streamflow and other flow values were obtained at all sampling locations (either directly by project personnel or from USGS or Bureau of Reclamation gaging stations) and field parameters (water temperature, pH, dissolved oxygen, and specific conductance) were measured at most sites. Other water-quality surveys for nutrients were conducted in 2005–07 in support of targeted reach-scale studies and a small number of samples were collected in 2006 and 2007 from 10-cm deep piezometer wells inserted into the riverbed to collect pore water and measure nutrient concentrations and field parameters. Water samples were collected using USGS methods (USGS, variously dated). All surface-water samples were depth and width integrated, except for grab samples taken from the wastewater treatment plants and during some of the reach-scale studies. All water-quality samples except suspended-sediment were analyzed at the Bureau of Reclamation Pacific Northwest Laboratory in Boise, Idaho. Suspended-sediment samples were analyzed at the USGS Cascade Volcano Observatory laboratory in Vancouver, Washington. The results from all water-quality measurements made during this study are available online through the USGS National Water Information System (http://pubs.usgs.gov/fs/FS–027–98/) (U.S. Geological Survey, 1998) and the Washington State Department of Ecology (WADOE) Environmental Information Management System (http://www.ecy.wa.gov/eim/) (Washington State Department of Ecology, 2007). Algal Biomass MeasurementsAlgal assemblages were evaluated qualitatively (presence/absence for general taxonomic categories) on select field trips and longitudinal surveys conducted during 2005–07, and quantitative samples were collected for periphyton biomass (Chl a and ash-free dry mass, AFDM) in 2006 and 2007 between RM 103 and 87 in the lower Yakima River, and below RM 12 in the Naches River. Epiphytic algae attached to rooted or floating macrophytes were observed—the abundance of this type of algae was not quantified, but was noted in field observations. Water samples also were collected intermittently in the Yakima River and analyzed for Chl a, an estimate of the amount of algae in the water column, at the continuous monitor locations for quality-assurance purposes. Periphyton biomass samples were collected on 13 occasions during the 2005–07 growing season from wadeable habitats that supported algal growth—rock or cobble substrates in shallow riffles and runs. For partially wadeable sites, rocks were collected from stream margins in areas of flowing water. Periphyton biomass samples were collected from the tops of river cobbles in relatively shallow (~0.5–3 ft) depths in mostly laminar habitats. To randomize rock selection, washers with short lengths of orange flagging were hand-tossed from shore to 5–10 locations within the sampling zone, and the rock or cobble immediately upstream of the washer was carefully removed and brought to the bank where algal material was collected using the top-rock/cylinder scrape method (Moulton and others, 2002). Processing of periphyton biomass samples occurred offsite by homogenizing in an electric blender and subsampling small volumes of the algal slurry, typically 5–10 mL. Subsamples for algal biomass were removed from the blender using a large-orifice pipette and transferred onto 47-mm glass fiber filters (GF/F) under vacuum pressure using a plastic filtration apparatus. Chl a and AFDM were analyzed at the Bureau of Reclamation Laboratory in Boise, Idaho. Chl a was analyzed spectrophotometrically with acid correction, and AFDM (ash-free dry mass) was analyzed gravimetrically using standard methods (American Public Health Association, 1989). Macrophyte Biomass MeasurementsMacrophyte biomass samples were collected in late August and early September in 2-mi sections of the Zillah, Mabton and Kiona reaches in 2005, and in the Kiona reach in 2006 and 2007 at approximately the same locations that were sampled in 2005. Macrophyte samples were collected from six transects randomly selected within each reach section by wading in the shallows or with SCUBA divers. Samples were collected at five roughly equally spaced points across each transect. To avoid sampler bias, a weighted marker with a float was thrown from a small raft to each point to mark each sampling location. Quadrat sampling areas ranged from 0.08 to 0.19 m2 per sample. Plants were identified to species, stripped of their roots (if present), and placed in labeled plastic bags. Plants were further processed offsite: they were rinsed with tap water to remove debris (sediment and attached algae), placed outside and air dried for 3–9 days, turning about every other day, and dried in an forced-air oven for 2–6 days at 70ºC. Samples were weighed to the nearest 0.1 g. In 2005, 12 dried plant tissue samples were shipped to Soiltest Farm Consultants, Inc. in Moses Lake, Washington, for total nitrogen, total phosphorus, and total carbon analyses. The samples analyzed for nutrient and carbon content included the stems and leaves and consisted of either the total amount of plant sample from a particular quadrat (for small sample sizes) or a subsample (for the larger sample sizes) from a particular quadrant. To subsample, the entire sample was crushed into relatively small particles, well-mixed, then several small portions were withdrawn by hand. All macrophyte biomass results are available at http://or.water.usgs.gov/projs_dir/yakima_nutrients/ (U.S. Geological Survey, 2008). StreamflowData from USGS and Bureau of Reclamation (Bureau of Reclamation, 2006) streamflow gaging stations are used in this report (table 15). Additional instantaneous streamflow measurements were made according to standard USGS protocols (U.S. Geological Survey, variously dated). Continuous Monitoring of Field ParametersContinuous field parameter data were collected at 15- or 30- minute intervals for water temperature, specific conductance, dissolved oxygen, pH, Chl a, and turbidity using YSI 6600 multiparameter sondes (YSI, 2008). The operation of continuous monitors is described by Wagner and others (2006). A continuous water-quality monitor was installed in the Yakima River at Kiona (RM 30) from April 20, 2004 to September 28, 2007, in the Yakima River near Zillah (RM 87) from March 1 to October 13, 2005, and from March 7 to October 3, 2006, and in the Yakima River near Mabton (RM 55) from February 28 to November 3, 2005. Chl a was measured during the monitor deployment at Kiona until early April 2006 and at Mabton and Zillah during the entire monitor deployments in 2005. Continuous water-quality monitors were installed for short periods (5–14 days) in nine reaches in the lower Yakima River and one reach of the lower Naches River during 2004 (fig. 2). These monitor deployments were used to assess spatial and seasonal variations in river conditions during 2004 within river reaches that were thought to be distinct from each other based on geomorphology, streamflow, and nutrient loading (Stuart McKenzie, U.S. Geological Survey (ret.), oral commun., 2003). Monitor deployments were repeated from two to five times at each site from March through October in 2004. Short-term continuous water-quality monitors also were installed during the entire months of July and August in the Kiona reach in 2005 and 2007 and in the Zillah in 2005 as part of two-station productivity experiments. Short-term continuous water-quality monitors also were installed for 14-day periods during July–September in the Zillah reach in 2006 and 2007 and in the Naches River in 2007 in support of periphytometer experiments and to assess longitudinal patterns in water quality. Continuous water-quality data were not obtained during some of the periphytometer deployments due to malfunctions with monitoring equipment. An optical dissolved oxygen probe (YSI model 6150) was installed on the Kiona monitor in July 2006, which produced two sets of dissolved oxygen data until February 2007, when the Clark cell type dissolved oxygen probe (YSI model 6562) was removed. Continuous measurement of water-column turbidity (the cloudiness or opacity of a liquid which is measured by analyzing the light-absorbing and light-scattering properties) was obtained with an infrared light probe (YSI model 6136), which reports turbidity in terms of Formazin Nephelometric Units (FNU). Continuous measurements of water-column total chlorophyll were obtained with an optical fluorescence probe (YSI model 6025) that measures chlorphyll fluorescence at wavelengths from 630–700 nanometers and were calibrated to a standard solution of acridine orange. The total chlorophyll data from the probe provided a near-continuous estimate of the amount of algal material in the water column during monitor deployments. The continuous field parameter data from this study (unit and daily values) can be obtained by accessing the USGS Data Grapher web page (http://or.water.usgs.gov/cgi-bin/grapher/graph_setup.pl) (U.S. Geological Survey, 2002). Daily summaries of the continuous field parameter data also are available through the USGS National Water Information System (http://waterdata.usgs.gov/nwis/) (U.S. Geological Survey, 1998) and WADOE Environmental Information Management System (http://www.ecy.wa.gov/eim/) (Washington Department of Ecology, 2007). Periphytometer ExperimentsThe primary productivity of periphyton was assessed through the use of nutrient-diffusing substrate (NDS) periphytometers. These devices measure the accrual rate of periphyton (as Chl a in milligrams per square meter per day) while delivering bioavailable forms of nitrogen (N) and phosphorus (P). Nutrients were added alone or in combination to test for single nutrient limitation or co-limitation compared to controls with no nutrient additions. NDS periphytometers also were used to estimate periphyton community growth rates along a single limiting-nutrient enrichment gradient. As part of the investigation of how nutrients influence the primary productivity of periphyton, an experimental nutrient enrichment gradient was established using liquid-liquid NDS periphytometers (Matlock and others, 1998). Periphytometers were installed in 2006 at four sites in the Zillah reach at RM 103, 92, 89 and 87, and in 2007 at RM 103 and 87, at RM 12.2, 3.5 and 2.8 in the lower Naches River, and at one downstream site on the Yakima River at Kiona (table 15). In all cases, periphytometers were modified from a design developed by Matlock and others (1998). These Micro-NDS periphytometers have reduced reservoir volume and reduced exposed filter area compared to the original design (see McFarland and others, 2004, and Rodriguez and Matlock, 2008 for design details). Unlike the Matlock design, the Micro-NDS periphytometers were installed at the bottom of the water column directly on the substrate and anchored into place using two torpedo-shaped weights. Filters were covered with 0.5-mm neutral density fiberglass screens to reduce grazing by fish and benthic invertebrates. During the periphytometer deployment at RM 87 in August and September 2007, however, an unscreened periphytometer also was installed to measure any difference in results between screened and unscreened experiments. Three nutrient treatments plus a control were used at each periphytometer deployment site in the Yakima and Naches Rivers. The treatments and the number of replicates were balanced at each site, but not between sites. All nutrient additions were at a single level with five or more replicates per treatment. Nutrient media additions of 3 mg/L NO3-N and 1 mg/L PO4-P provided 350 micromolar (µM) N and 100 µM P solutions in the Micro-NDS media reservoirs. After the periphytometers were installed, nutrients were delivered to the filter substrate by diffusion during instream incubation. Filters were retrieved after 14 days and frozen until analysis (within 28 days of retrieval). Algal biomass production was measured as Chl a accumulation on the glass-fiber filter substrates over the 14-day period. Nutrient treatments were compared to the ambient controls to test for nutrient limitation. Data AnalysisComparison of Results to Water-Quality Reference Criteria and StandardsMeasurements of nutrient concentrations, algal biomass, and field parameters made during this study were compared to applicable reference conditions, nuisance conditions, and standards. Criteria for Nutrients and Algal BiomassThe State of Washington has not established standards for nutrients and algal biomass. The U.S. Environmental Protection Agency (USEPA), however, has published suggested reference conditions on a regional scale to protect water bodies from the negative effects of nutrient enrichment, including excessive algal growth. The reference conditions are not water-quality standards, but are intended to be starting points for States and Tribes to use for setting their own regional nutrient criteria. The lower Yakima River basin is in the USEPA Nutrient Ecoregion III (Xeric West), subgroup 10 (Columbia Plateau) (U.S. Environmental Protection Agency, 2000b). Suggested nutrient reference conditions for Yakima River basin streams in the Xeric West Ecoregion are given in table 2. The suggested reference conditions for streams in the Yakima River basin were based on the 25th percentile of the lowest nutrient concentrations, representing the least impacted conditions and intended to be protective of designated uses (U.S. Environmental Protection Agency, 2000b). Although the USEPA also has published suggested algal reference conditions for the Yakima River basin (U.S. Environmental Protection Agency, 2000b), these values were based on a small number of samples that may not have been representative of reference conditions in the basin. Numerous studies have published recommended ranges or limits to describe periphyton biomass levels indicative of nuisance conditions (Horner and others, 1983; Welch and others, 1988; Welch and others, 1989; Biggs, 1996; Dodds and others, 1997; Dodds and others, 1998). Many benchmarks were developed to protect recreational or aesthetic qualities of streams and rivers, and (or) to protect aquatic life from unhealthy conditions that result from excessive algal growths such as low dissolved oxygen concentrations, high pH, and affects on salmon spawning beds. A generally accepted nuisance threshold for periphyton biomass is between 100 and 150 mg/m2 for Chl a. The government of British Columbia, Canada, established a Chl a density of 100 mg/m2 as indicative of nuisance growth for periphyton in streams (British Columbia Ministry of Environment, 2008). This value was used to compare samples collected during this study. The State of Washington currently does not use phytoplankton biomass as a tool for assessing stream health. The State of Oregon, however, has established a Chl a concentration of 15 µg/L as indicative of nuisance growth for phytoplankton in streams (Oregon Administrative Code, 2006). This value was used to compare samples collected during this study. Standards for Temperature, Dissolved Oxygen, and pHWater temperature, dissolved oxygen, and pH conditions were compared to the Washington State standards and described using the percentage of days and the percentage of time when exceedences occurred during a particular period. The former was calculated by dividing the number of days with at least one exceedence of the Washington State standard by the total number of days when measurements were made (only days with 24 hours of monitoring were included) and the latter was calculated by dividing the number of readings exceeding the Washington State standard by the total number of readings. The State of Washington has established standards for water temperature, dissolved oxygen, and pH for the lower Yakima River (Washington Administrative Code, 2006). Water temperature shall not exceed 21°C due to human activities except when natural conditions exceed 21°C, in which case no temperature increase is allowed that will raise the receiving water temperature by more than 0.3°C. Under the Washington State water-quality standards, the lower Yakima River is in the category of salmonid spawning, rearing, and migration habitat. Based on this designation, the water-quality standards specify a lowest 1-day minimum dissolved oxygen concentration of 8.0 mg/L and that the pH shall be within the range of 6.5 to 8.5 units with a human-caused variation within this range of less than 0.5 pH units. Although continuous monitoring data were collected throughout the year at one station (Kiona), most of the descriptions and analyses in this report are limited to the irrigation season results (March 1 through September 30) because this was the period when the effects from eutrophication were most severe. The differences in the severity of water-quality conditions between the Zillah, Mabton, and Kiona reaches and between years was evaluated by comparing the mean daily maximum water temperature and pH readings and mean daily minimum dissolved oxygen concentrations between July 1 and August 31, the period with the highest water temperature and pH values and lowest dissolved oxygen concentrations. Redfield RatioRedfield ratios were used to characterize the nutrient status of the Zillah reach regarding algal growth. The Redfield ratio is calculated using the dissolved inorganic (bioavailable) forms of N (dissolved nitrite plus nitrate and dissolved ammonia, or DIN) and P (soluble reactive phosphorus, or SRP). The ratio of DIN to SRP indicates the relative availability of the two primary nutrients that aquatic plants require for growth. During algal growth, about 16 atoms of N are used for every atom of P—7:1 by weight, which is the Redfield ratio. The Redfield ratio does not apply to the growth of macrophytes, which are able to obtain nutrients from their roots and tend to have much higher N:P ratios than algae. Fernandez-Alaez and others (1999) determined that the N:P ratios for 12 lake macrophytes ranged from 13 to 121, with a mean of 35.
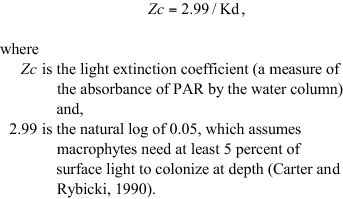
Estimates of Gross Primary ProductivityOne objective of this study was to assess the relations among physical parameters and aquatic plant characteristics—especially whole stream gross primary productivity (GPP), because GPP is a measure of the growth rate of plants in a stream. The diel (24-hour) oxygen curve method for estimating GPP (Odum, 1956), which has been used frequently to evaluate the productivity of stream ecosystems (Izagirre and others, 2008), was evaluated as a tool that might be used by environmental managers to assess the conditions of the Yakima River with regard to the rate of plant growth. This method for estimating GPP was evaluated for two applications: (1) as an estimate of the rate of plant growth instead of direct biomass measurements and (2) as a way to assess the processes and factors related to the rate of aquatic plant growth. The diel dissolved oxygen curve method calculates GPP (in grams of O2 produced per square meter per day) by using the daily change in dissolved oxygen concentration measured by continuous monitoring at one or two monitoring stations, an estimate of the rate of oxygen transfer between the water and the atmosphere, and the depth of the stream. The one-station method is acceptable if the metabolic characteristics of the water flowing into and out of a study reach are similar. Otherwise, the two-station method is recommended (Britton and Greeson, 1989). The one-station method was used in this study to show seasonal and year-to-year differences in GPP. The two-station method was used, however, in some instances as a check on the suitability of the one-station method. The continuous monitoring of dissolved oxygen and water temperature and the availability of nearby daily gaging station records provided a rich data set for estimating GPP. The GPP estimates were determined using a spreadsheet developed at the Central Plains Center for Bioassessment at the University of Kansas that incorporates the methods proposed by Odum (1956) (Anderson and Huggins, 2003). GPP was estimated at 3-day intervals for two periods during the growing season. The first period was spring (defined as March 1 through June 30), when the conditions in the river (streamflow, turbidity, temperature) are most variable (within this period and between years) and when the macrophytes start to grow. The second period was summer (defined as July 1 through August 31), when streamflow is relatively consistent between years and when the macrophytes have achieved their maximum biomass. The GPP analysis was limited to 2005 through 2007 because the 2004 water-quality record was incomplete and conditions during these 3 years were representative of the variability in macrophyte abundance during the study. One-station estimates of GPP were made at Kiona during March 1–August 30, 2005–07, and at Zillah during July 1–August 30, 2005. Two-station estimates of GPP were made at Kiona during July 19–September 26, 2005, July 7–13, 2007, and August 6–12, 2007, and at Zillah during July 22–August 30, 2005. For the two-station GPP estimates a second monitor was installed 2.0 and 1.5 mi upstream of the Kiona and Zillah monitors, respectively. Appropriate reaeration coefficient equations from the literature were used instead of experimentally derived values and were selected based on streamflow conditions (Anderson and Huggins, 2003). The mean reach-scale values for velocity and depth were needed for each day a GPP estimate was made. These values were obtained by measuring the water depth and water velocity longitudinally and horizontally along each study reach and scaling the measured values to reflect changes in streamflow. These measurements were made during July 2005 in the Kiona and Zillah reaches and repeated in July 2007 in the Kiona reach. A detailed description of the data collection and limitations with regards to the reaeration estimates is contained in appendix B (PDF, 104 KB). Maximum Depth of Plant ColonizationPhotosynthetically active radiation (PAR) data were used to calculate the maximum depth of macrophyte colonization (or compensation depth), Zc, measured in meters, using the following equation, which was derived from Beer’s Law:
The estimated values for maximum depth of plant colonization (based on the light attenuation data for all three reaches of the lower Yakima River and the Naches River during 2005–07) were compared to concurrent turbidity readings to determine whether turbidity could be used to predict the maximum depths of plant colonization in the river. Statistical Comparisons Between Data SetsThe two-sample t-test was used to compare the mean values for two data sets that were normally distributed. A standard ANOVA was used to compare the mean values for multiple data sets that were normally distributed, and Tukey’s procedure was used to determine whether the 95 percent confidence intervals (based on the pooled standard deviation) for the mean values of any of the data sets overlapped. The Kruskall-Wallis rank test was used to compare the median values for multiple data sets that were not normally distributed, and the Wilcoxon signed rank test was used to determine whether the 95 percent confidence intervals for the median values of any of the data sets overlapped (Walpole and others, 2007). The relations between data sets were evaluated using linear and nonlinear regressions. The strength of a relation was evaluated using the r2 value and a p-value ≤ 0.05 was used to indicate whether a relation was significant. The algal accrual rates measured during the periphytometer experiments were log-transformed to preserve homogeneity of variances and to allow for straightforward comparisons between geometric means (the nth root of the product of n values) for all sites and treatments. Log-transformed data were analyzed using a full factorial ANOVA that tested for site by treatment interactions. Each treatment was at a single level and was compared to the no-addition control at each site. For this report, data from each periphytometer deployment were analyzed by river and by year. Data Quality ControlQuality control (QC) samples comprised about 15 percent of all discrete samples, and consisted of field blank samples to check for potential contamination during collection, processing, and (or) laboratory analysis; replicate water samples to measure variability and analytical precision; and split samples to measure bias during processing and analysis. The results from the QC analysis for the discrete water-quality sampling are provided in appendix C (PDF, 256 KB). The QC activities for the continuous monitoring of field parameters were generally done in accordance with USGS guidelines (Wagner and others, 2006). Calibration and fouling corrections were calculated and applied to almost all the data—exceptions were the short-term monitor deployments from April through June 2004 and some periods in 2004 during the Kiona monitor deployment. Although the data quality control for many of the 2004 short-term monitor deployments did not follow the specifications in the USGS guidelines, problems caused by calibration drift were minimized because the calibrations were checked at the beginning of each monitor deployment and because of the short-term nature of the monitor deployments. Problems due to sensor fouling during the 2004 short-term monitor deployments were minimized because the monitors were routinely cleaned and serviced. The specifications in the USGS guidelines were followed for all 2004 monitor deployments after July 1 and all monitor deployments in 2005–07. The results from the QC activities for the continuous monitoring are provided in appendix D (PDF 188 KB). Quality assurance of the fluorometric total chlorophyll data collected at each of the continuous monitors included frequent calibrations with standard solutions of acridine orange, and comparisons with Chl a values obtained from traditional laboratory analyses of whole-water grab samples. When aggregated together, the probe measurements and laboratory data collected at all Yakima River monitor deployments were not significantly correlated. The results from the Zillah water-quality monitor, however, showed good agreement with the eight concurrent water samples (r2=0.80, p < 0.001, with a ratio of 1.5 between the laboratory results and the probe), providing some degree of confidence in the total chlorophyll data from this continuous monitor. Total chlorophyll data from the other continuous monitors also were useful at times for explaining the general patterns observed in other water-quality parameters. No corrections were applied to the continuous total chlorophyll data to adjust for variations from the laboratory Chl a results. Most ambient monitoring programs in the Yakima River basin use turbidity meters, which measure turbidity in NTU. Because suspended particles scatter light of different wavelengths with varying efficiency, FNU data often are not directly comparable to NTU data. Turbidity was measured intermittently during this study at the continuous monitoring sites using a turbidity meter that read in NTU. The ratio between the values measured in NTU and the concurrent values measured in FNU was equal to 0.95 when the linear relation between the two values was fixed at zero. Some readings in 2004 and 2005 were less than 0 FNU, which was probably due to improper calibration of the probe. |
For additional information contact: Part or all of this report is presented in Portable Document Format (PDF); the latest version of Adobe Reader or similar software is required to view it. Download the latest version of Adobe Reader, free of charge. |

![]() U.S. Department of the Interior | U.S. Geological Survey
U.S. Department of the Interior | U.S. Geological Survey
URL: http://
pubsdata.usgs.gov
/pubs/sir/2009/5078/section3.html
Page Contact Information: Contact USGS
Page Last Modified:
Thursday, 10-Jan-2013 19:30:32 EST

 (1)
(1)