Scientific Investigations Report 2009–5188
|
For additional information contact: Part or all of this report is presented in Portable Document Format (PDF); the latest version of Adobe Reader or similar software is required to view it. Download the latest version of Adobe Reader, free of charge. |
Holtschlag, D.J., 2009, Application guide for AFINCH (analysis of flows in networks of channels) described by NHDPlus: U.S. Geological Survey Scientific Investigations Report 2009-5188, 106 p.
Preface
Abstract
Introduction
Methods and Data Used in AFINCH Modeling
AFINCH Code
Mapping Water Yields in Catchments and Streamflow at Flowlines
Limitations of AFINCH and Suggestions for Future Development
Summary
Acknowledgments
Literature Cited
Appendix 1. Starting AFINCH (AFinch)
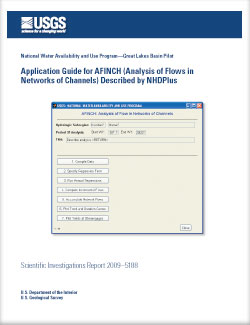
Appendix 2. A Graphical User Interface for AFINCH (AFinchGUI)
Appendix 3. Initialize Common Variables in the Matlab Workspace (AFIniAFStruct)
Appendix 4. Setup Data for AFINCH (AFSetupData)
Appendix 5. Read in National Land Cover Data (AFReadNLCD)
Appendix 6. Read in PRISM Precipitation Data (AFReadPrismPrec)
Appendix 7. Associate NHDPlus Flowlines with Streamflow Gaging Stations (AFGenStrucData)
Appendix 8. Read in monthly Streamflow Data at Gaging Stations (AFReadInFlowWY)
Appendix 9. Develop and Display Annual Network Design Matrices (AFStaBasinGridComIDWY)
Appendix 10. Plot the Relation Between Drainage Areas and Flows at Streamgages (AFPlotAreasFlows)
Appendix 11. Plot Image of Monthly Water Yields by Streamgage (AFYieldImage)
Appendix 12. Read in PRISM Air Temperature Data (AFReadPrismTemp)
Appendix 13. Compute the Previous Month's Precipitation (AFGenLag1Precip)
Appendix 14. Create Boxplots Showing the Distribution of Explanatory Variables (AFBoxplotExplanVar)
Appendix 15. Calls Graphical User Interface for User-Specified Water Yield Regression Equation (AFCallRegCheckBox)
Appendix 16. Graphical User Interface for User-Specified Regression Equation (AFRegCheckBoxGUI)
Appendix 17. Estimate Parameters for User-Specified Regression Equation with Data for the Entire Period of Analysis (AFRegressPOA)
Appendix 18. Estimate Parameters for Regression Equation by Water Year (AFRegressByWY)
Appendix 19. Plot Annual Estimates of Regression Equation Parameters (AFPlotRegressCoeff)
Appendix 20. Compute Estimates of Adjusted Incremental Water Yields and Flows (AFQEstAdjInc)
Appendix 21. Compute Constrained Estimates of Adjusted Incremental Water Yields and Flows (AFQConAdjInc)
Appendix 22. Plot monthly Estimates of Flows for the Period of Analysis (AFPlotQmMeaEst)
Appendix 23. Write Estimates of Water Yields and Flows to Files (AFWrtQYEstCon)
Appendix 24. Accumulate Flows Throughout the NHDPlus Network (AFConFlowAccum)
Appendix 25. Plot Time Series of Monthly Flows and Display Monthly Flow Duration Curves (AFTrendDurations)
Appendix 26. Compute Kendall's tau Correlation Coefficient and Sen's Monotonic Trend Slope Statistic (AFKenSen)
Appendix 27. Graphical User Interface for Plotting Images of Monthly Water Yields (AFYieldAtGagesGUI)
Appendix 28. Plot Image of Water Yields at Historically Gaged Streams (AFImagePOAYield)
Appendix 29. Identify Streamgages and Gaging Activity from Image Plot(AFid)

![]() U.S. Department of the Interior |
U.S. Geological Survey
U.S. Department of the Interior |
U.S. Geological Survey
[an error occurred while processing this directive]
URL: http://pubsdata.usgs.gov
Page Contact Information: Contact USGS
Page Last Modified: Thursday, 10-Jan-2013 19:38:47 EST