
Scientific Investigations Report 2009–5272
Prepared in cooperation with the Massachusetts Department of Conservation and Recreation
Indicators of Streamflow Alteration, Habitat Fragmentation, Impervious Cover, and Water Quality for Massachusetts Stream Basins
By Peter K. Weiskel, Sara L. Brandt, Leslie A. DeSimone, Lance J. Ostiguy, and Stacey A. Archfield
Abstract
Massachusetts streams and stream basins have been subjected to a wide variety of human alterations since colonial times. These alterations include water withdrawals, treated wastewater discharges, construction of onsite septic systems and dams, forest clearing, and urbanization—all of which have the potential to affect streamflow regimes, water quality, and habitat integrity for fish and other aquatic biota. Indicators were developed to characterize these types of potential alteration for subbasins and groundwater contributing areas in Massachusetts. The potential alteration of streamflow by the combined effects of withdrawals and discharges was assessed under two water-use scenarios. Water-use scenario 1 incorporated publicly reported groundwater withdrawals and discharges, direct withdrawals from and discharges to streams, and estimated domestic-well withdrawals and septic-system discharges. Surface-water-reservoir withdrawals were excluded from this scenario. Water-use scenario 2 incorporated all the types of withdrawal and discharge included in scenario 1 as well as withdrawals from surface-water reservoirs—all on a long-term, mean annual basis. All withdrawal and discharge data were previously reported to the State for the 2000–2004 period, except domestic-well withdrawals and septic-system discharges, which were estimated for this study. The majority of the state’s subbasins and groundwater contributing areas were estimated to have relatively minor (less than 10 percent) alteration of streamflow under water-use scenario 1 (seasonally varying water use; no surface-water-reservoir withdrawals). However, about 12 percent of subbasins and groundwater contributing areas were estimated to have extensive alteration of streamflows (greater than 40 percent) in August; most of these basins were concentrated in the outer metropolitan Boston region. Potential surcharging of streamflow in August was most commonly indicated for main-stem river subbasins, although surcharging was also indicated for some smaller tributary subbasins. In the high-flow month of April, only 4.8 percent of subbasins and groundwater contributing areas had more than 10 percent potential flow alteration. A majority of the state’s subbasins and groundwater contributing areas were also indicated to have relatively minor alteration of streamflow under water-use scenario 2 (long-term average water use, including surface-water-reservoir withdrawals). Extensive alteration of mean annual flows was estimated for about 6 percent of the state’s subbasins and groundwater contributing areas. The majority of subbasins estimated to have extensive long-term flow alteration contained reservoirs that were specifically designed, constructed, and managed to supply drinking water to cities. Only a small number of subbasins and groundwater contributing areas (1 percent) were extensively surcharged on a long-term, mean annual basis. Because site-specific data concerning surface-water-reservoir storage dynamics and management practices are not available statewide, the seasonal effects of surface-water-reservoir withdrawals on downstream flows could not be assessed in this study. The impounded storage ratio (volume of impounded subbasin or groundwater-contributing-area storage divided by mean annual predevelopment outflow from the subbasin or contributing area, in units of days) indicates the potential for alteration of streamflow, sediment-transport, and temperature regimes by dams, independent of water use. Storage ratios were less than 1 day for 33 percent of the subbasins and groundwater contributing areas, greater than 1 month for about 40 percent of the cases, and greater than 1 year for 3.2 percent of the cases statewide. Dam density, an indicator of stream-habitat fragmentation by dams, averaged 1 dam for every 6.7 stream miles statewide. Many of these dams are not presently (2009) being managed. The highest dam densities were in portions of Worcester County and in the Plymouth-Carver region, respectively, reflecting the historical reliance of Massachusetts industry upon water power and agricultural water-management practices in southeastern Massachusetts. Impervious cover is a frequently used indicator of urban land use. About 33 percent of the state’s 1,429 subbasins and groundwater contributing areas are relatively undeveloped at the local scale, with a local impervious cover of less than 4 percent. About 18 percent of Massachusetts subbasins and contributing areas are highly developed, with a local impervious cover greater than 16 percent. The remaining 49 percent of subbasins and contributing areas have levels of urban development between these extremes (4 to 16 percent local impervious cover). Cumulative impervious cover, defined for the entire upstream area encompassed by each subbasin, shows a smaller range (0 to 55 percent) than local impervious cover. Both local and cumulative impervious cover were highest in metropolitan Boston and other urban centers. High elevated impervious-cover values were also found along major transportation corridors. The water-quality status of Massachusetts streams is assessed periodically by the Massachusetts Department of Environmental Protection pursuant to the requirements of the Federal Clean Water Act. Streams selected for assessment are commonly located in larger subbasins where some degree of impairment is expected. In the 72 percent of the state’s subbasins and groundwater contributing areas with assessed streams in 2002, more than 50 percent of the assessed stream miles were considered impaired. All of the assessed stream miles were considered impaired in 66 percent of the subbasins and groundwater contributing areas with assessed streams. Large streams, such as the main stems of rivers that make up most of the assessed stream miles, also are in many cases the receiving waters for treated wastewater discharges and for this reason may be more susceptible to water-quality impairments than smaller streams. Subbasins and contributing areas with large fractions of assessed stream miles that are listed as impaired are distributed across the state, but are more prevalent in eastern Massachusetts. |
For additional information contact: |
Suggested citation:
Weiskel, P.K., Brandt, S.L., DeSimone, L.A., Ostiguy, L.J., and Archfield, S.A., 2010, Indicators of streamflow alteration, habitat fragmentation, impervious cover, and water quality for Massachusetts stream basins: U.S. Geological Survey Scientific Investigations Report 2009–5272, 70 p., plus CD–ROM.
Contents
Acknowledgments
Abstract
Introduction
Delineation of Massachusetts Subbasins and Groundwater Contributing Areas
Indicators of Potential Streamflow Alteration from Water Use
Indicators of Potential Streamflow Alteration and Habitat Fragmentation by Dams
Indicators of Impervious Cover
Indicators of Water Quality
Limitations of the Basin-Alteration Indicators
Summary
References Cited
Appendix 1. Tables of Alteration Indicators and Water-Use Information for Massachusetts Stream Basins
Appendix 2. Digital Map Viewer of Massachusetts Stream Basins, Alteration Indicators, and Water-Use Information
Special Considerations Regarding GIS Content
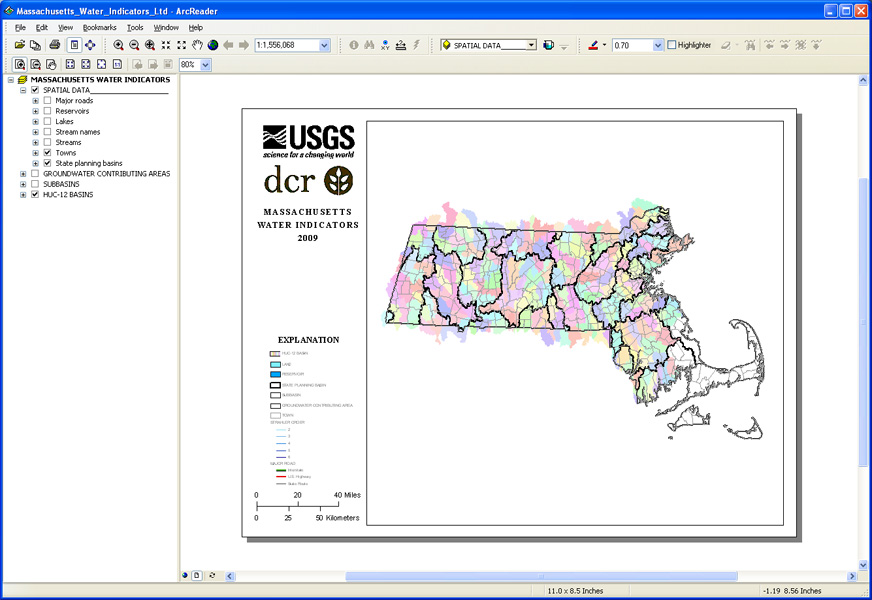
The graphic shown is an example of what can be generated by the published map file (.pmf) when run through a geographic information system. It is impractical to run the GIS through a typical internet connection. To use the .pmf and its associated data, either download the .zip package for Appendix 2 and then unzip to a folder on your hard drive (see hierarchy below), or make a CD through either the .iso or .gi packages. (Warning: It may take 15 minutes or longer to download either of these packages.) Go to the sidebar to download materials. (The download window will most likely appear underneath the web page window you are presently looking at.)
For the map viewer to work properly, the structure of Appendix 2 must be arranged as follows:
appendix_2
Map
map_viewer_guide_vs2.doc
map_viewer_guide_vs2.pdf
Massachusetts_Water_Indicators_Ltd.pmf
The .pmf will link up with the Map folder and its subfolders:
Map
spatialdata
symbolset
The subfolders spatialdata and symbolset contain 54 data files: arc.dir, .dbf, .ldb, .lyr, .mdb, .prj, .sbn, .sbx, .shp, .shx, .jpg, .xml
Important: Start up your GIS software prior to clicking to open the .pmf (which takes about 5 minutes to draw). The map is presented in two modes: Layout View and Data View. Toggle between the two modes to display certain coverages. Detailed information such as roads, stream names, basin numbers, and subbasin numbers are only visible when zoomed into closely in Data View mode. For detailed instructions about the interactive map, click here to read the Map Viewer Guide.
If you do not have a GIS, you can download a freeware viewer from ESRI (see sidebar).

![]() U.S. Department of the Interior |
U.S. Geological Survey
U.S. Department of the Interior |
U.S. Geological Survey
URL: http://pubsdata.usgs.gov/pubs/sir/2009/5272/index.html
Page Contact Information: GS Pubs Web Contact
Page Last Modified: Tuesday, 30-Jul-2013 12:41:10 EDT