Scientific Investigations Report 2010–5008
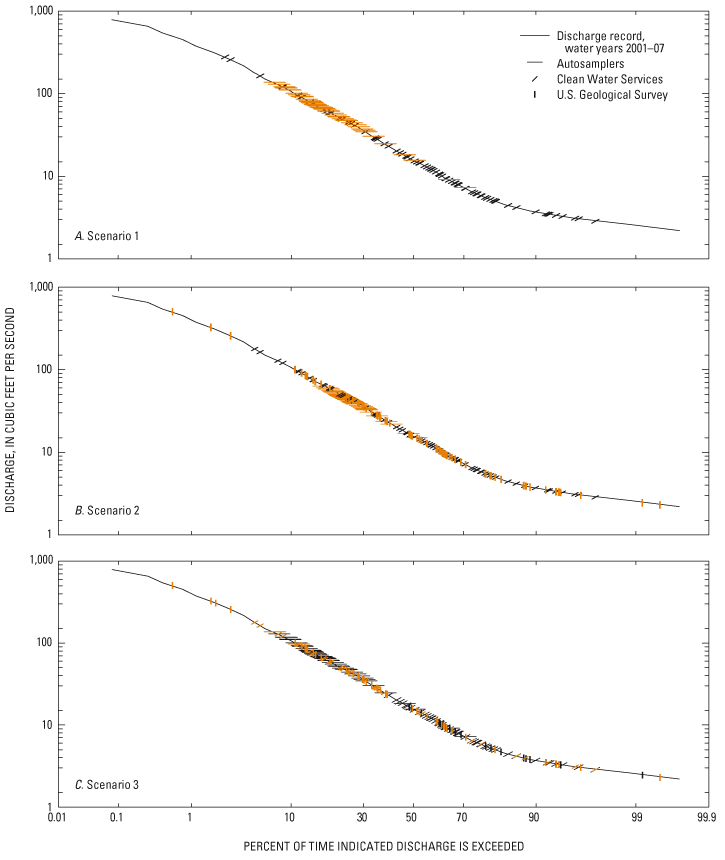
Figure 3. Flow duration curves with samples collected from each data source for (A) Scenario 1, (B) Scenario 2, and (C) Scenario 3, for Fanno Creek near Durham, Oregon, water years 2001–07. Samples used for model calibration are in orange, and samples used for model validation are in black. See table 6 for a description of the data aggregation into Scenarios 1, 2, and 3. |
First posted June 18, 2010 For additional information contact: Part or all of this report is presented in Portable Document Format (PDF); the latest version of Adobe Reader or similar software is required to view it. Download the latest version of Adobe Reader, free of charge. |

![]() U.S. Department of the Interior | U.S. Geological Survey
U.S. Department of the Interior | U.S. Geological Survey
URL: http://
pubsdata.usgs.gov
/pubs/sir/2010/5008/figure3.html
Page Contact Information: Contact USGS
Page Last Modified:
Thursday, 10-Jan-2013 19:12:15 EST
