Scientific Investigations Report 2010–5008
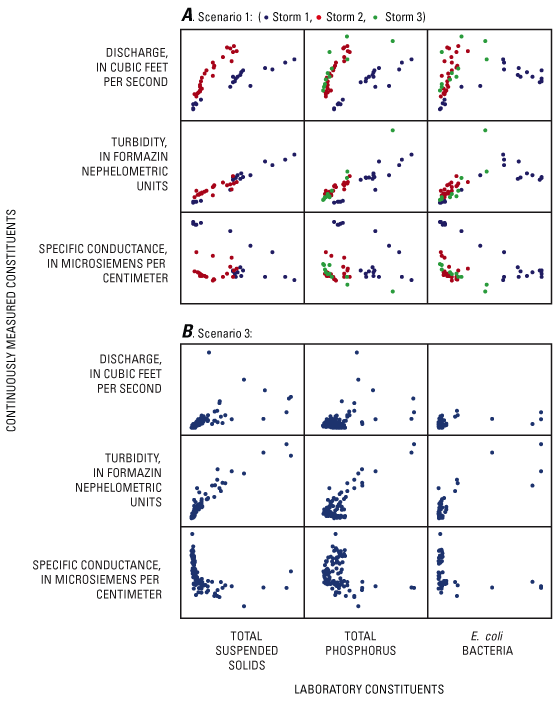
Figure 5. Matrixes of scatter plots of calibration data using (A) Scenario 1 and (B) Scenario 3 datasets, from Fanno Creek near Durham, Oregon. Scenario 1 data were from autosampler deployments: storm 1, June 17–18, 2002; storm 2, May 4–5, 2003; storm 3, May 8–9, 2003. Data sources for Scenario 3 include U.S. Geological Survey (USGS) historical data, Clean Water Services ambient monitoring, and autosamplers, from 2001 to 2007. All Escherichia coli (E. coli) bacteria data in (B) are from the Clean Water Services ambient monitoring program because no E. coli bacteria data were collected by USGS. Units for total suspended solids and total phosphorus are in milligrams per liter, and units for E. coli bacteria are in colonies per 100 millimeters. |
First posted June 18, 2010 For additional information contact: Part or all of this report is presented in Portable Document Format (PDF); the latest version of Adobe Reader or similar software is required to view it. Download the latest version of Adobe Reader, free of charge. |

![]() U.S. Department of the Interior | U.S. Geological Survey
U.S. Department of the Interior | U.S. Geological Survey
URL: http://
pubsdata.usgs.gov
/pubs/sir/2010/5008/figure5.html
Page Contact Information: Contact USGS
Page Last Modified:
Thursday, 10-Jan-2013 19:12:17 EST
