Scientific Investigations Report 2010–5065
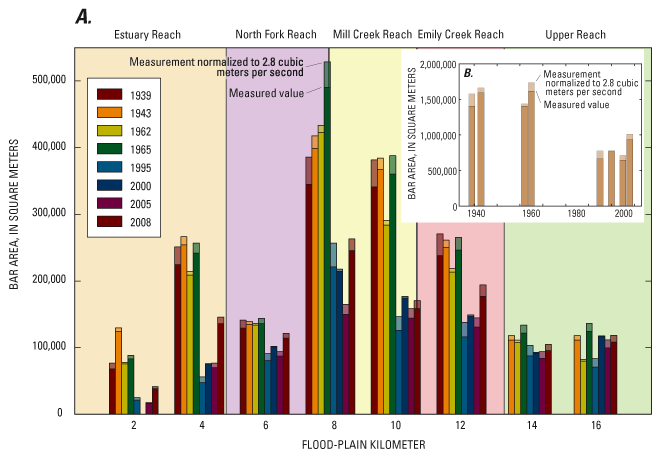
Figure 10. Spatial and temporal variation in gravel bar area for eight time periods, Chetco River, Oregon, 1939–2008. Bar extensions in lighter shades represent values normalized to a discharge of 2.8 cubic meters per second (m3/s). (A) Bar area aggregated by 2-kilometer lengths of flood-plain. No data for 1939 upstream from flood-plain kilometer 13. (B) Bar area for total study reach. |
First posted May 26, 2010 For additional information contact: Part or all of this report is presented in Portable Document Format (PDF); the latest version of Adobe Reader or similar software is required to view it. Download the latest version of Adobe Reader, free of charge. |

![]() U.S. Department of the Interior | U.S. Geological Survey
U.S. Department of the Interior | U.S. Geological Survey
URL: http://
pubsdata.usgs.gov
/pubs/sir/2010/5065/figure10.html
Page Contact Information: Contact USGS
Page Last Modified:
Thursday, 10-Jan-2013 19:09:54 EST
