Scientific Investigations Report 2010–5065
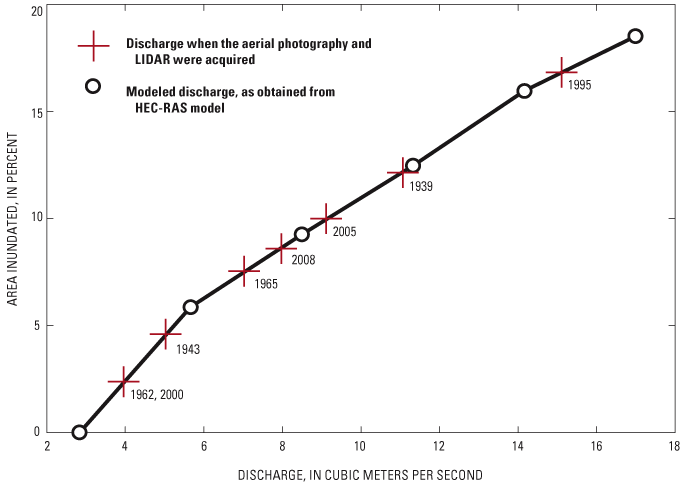
Figure 7. Bar area inundation compared with discharge, Chetco River, Oregon. Area inundated for each discharge was calculated on the basis of six modeled discharges between 2.8 and 17 cubic meters per second and overlaying corresponding inundated areas onto mapped bar areas. This relation was used to normalize bar and channel measurements from photograph sets to a common discharge of 2.8 cubic meters per second. Also shown are discharges for the seven photograph sets and the light detection and ranging (LIDAR) topography. |
First posted May 26, 2010 For additional information contact: Part or all of this report is presented in Portable Document Format (PDF); the latest version of Adobe Reader or similar software is required to view it. Download the latest version of Adobe Reader, free of charge. |

![]() U.S. Department of the Interior | U.S. Geological Survey
U.S. Department of the Interior | U.S. Geological Survey
URL: http://
pubsdata.usgs.gov
/pubs/sir/2010/5065/figure7.html
Page Contact Information: Contact USGS
Page Last Modified:
Thursday, 10-Jan-2013 19:10:51 EST
