Scientific Investigations Report 2010–5065
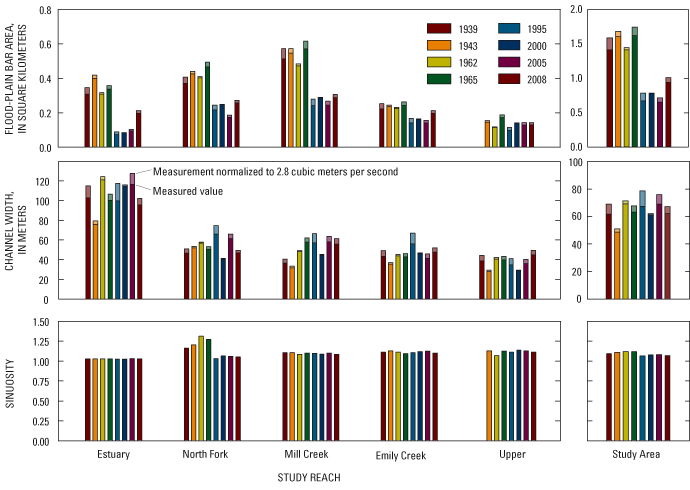
Figure 9. Summary of channel change in the study area, Chetco River, Oregon, 1939–2008. Bar extensions in lighter shades for bar area and channel width represent values normalized to a discharge of 2.8 cubic meters per second (m3/s). The photographs from 1939 only partly cover the Upper Reach; hence, no measurements from 1939 are available for bar area and sinuosity for that reach, and channel width is only a partial measurement. |
First posted May 26, 2010 For additional information contact: Part or all of this report is presented in Portable Document Format (PDF); the latest version of Adobe Reader or similar software is required to view it. Download the latest version of Adobe Reader, free of charge. |

![]() U.S. Department of the Interior | U.S. Geological Survey
U.S. Department of the Interior | U.S. Geological Survey
URL: http://
pubsdata.usgs.gov
/pubs/sir/2010/5065/figure9.html
Page Contact Information: Contact USGS
Page Last Modified:
Thursday, 10-Jan-2013 19:10:53 EST
