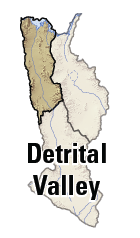
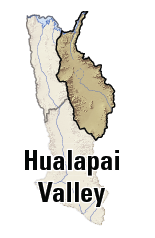
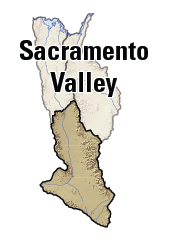
Figures 9, 10, and 11 from this report present water budgets for Detritial, Hualapai, and Sacramento Valleys in Northwestern Arizona. These figures show average values for each water-budget component. Uncertainty is discussed but not shown on these report figures.
As an aid to readers, these figures have been implemented as interactive, web-based figures here. Water-budget parameters can be varied within reasonable bounds of uncertainty and the effects those changes have on the water budget will be shown as they are varied. This can aid in understanding sensitivity—which parameters most or least affect the water budgets—and also could provide a generally improved sense of the hydrologic cycle represented in these water budgets.
To begin, choose one of the following interactive figures. Web-browser security settings may have to be changed to allow JavaScript to run:
Instructions
Each water-budget page shows changeable water-budget parameters along the left side, partitioned into 4 or 5 groups. To select a group (for example, "unsaturated zone") click its name. Parameters are changed by grabbing the slider control and moving it left or right with the mouse. The area on either side of a slider control also can be clicked to move the slider to that position. Many parameters can be changed only in fixed increments (for example, upland spring discharge can only change in incremenets of 100 acre-ft/yr); this may cause some slider bars to move less smoothly than others.
As parameters are changed, effects on the water budget will be indicated on the diagram on the right side of the screen. Blue text indicates an increase in a water-budget component; red text a decrease. Beneath each red or blue value, a parenthesized value indicates the magnitude of change.
To reset all water-budget parameters to published values, click the Reset Parameters button. To return to this screen, click Back to Instructions or the web-browser back button.
Explanation of Water-Budget Parameters
Mountain block
- Precipitation (acre-ft/yr; afy) — The amount of precipitation that falls on mountian blocks annually. This value is derived from a long-term rainfall dataset which contains uncertainty, and therefore this parameter can be increased or decreased by 10 percent.
- Evapotranspiration (annual percent of precipitation) — How much precipitation returns to the atmosphere from mountian blocks through evapotranspiration (ET). This was calculated by using a Basin Characterization Model that considers energy inputs that drive ET. This parameter contains an unknown amount of uncertainty, but for the purposes of these figures may be increased or decreased by about 2 percentage points.
- Recharge-to-runoff ratio — Of precipitation-derived water not returned to the atmosphere through ET, it is partitioned between mountain-block recharge and runoff using this ratio. Values less than 1.0 indicate more water becomes runoff than recharge; values above 1.0 indicate the opposite. This ratio calculated from outputs from a Basin Characterization Model (BCM) that considers properties of soils and rocks, and contains an unknown amount of uncertainty.
- Upland spring discharge (acre-ft/yr; afy) — Some mountain-block recharge may reemerge through upland mountain-block springs and become runoff. This was calculated by using an inventory of known springs and average measured discharge, and may be increased or decreased by about a factor of two.
Inflow from upgradient basin (Hualapai Valley only)
- Truxton Wash stream inflow (acre-ft/yr; afy) — Streamflow in Truxton Wash, which originates outside the study area, was not calculated by the BCM. Therefore, an annual estimate of its runoff was calculated by using a USGS streamgage. Uncertainty in this parameter primarily is because of the short period-of-record for the streamgage.
- Amount of infiltrated Truxton Wash stream inflow that becomes recharge (annual percent) — This value was arbitrarily chosen because alluvial streambeds are efficient at recharging aquifers because they are underlain by coarser-grained material, yet some of the infiltrating water likely returns to the atmosphere through ET by vegetation within and adjacent to the streambed. This value is uncertain, and can be varied between 10 and 80 percent.
- Value assumed in report: 45%
- Underflow beneath Truxton Wash, near Hackberry (acre-ft/yr; afy) — This underflow estimate is uncertain because of large changes in water-table elevation since the 1950s. It can be increased to 1000 acre-ft/yr or decreased to 0.
- Value assumed in report: 300 acre-ft/yr
Unsaturated zone
- Amount of infiltrated runoff that becomes recharges (annual percent) — The value for this parameter was chosen on the basis of values from comparable areas summarized in another report. It can be increased or decreased over a range of 20 percentage points.
- Value assumed in report: 10%
- Amount of infiltrated wastewater treatment plant (WWTP) treated effluent, septic-system effluent, and water-supply pipe leakage that becomes recharge (annual percent) — Without specific stuides to estimate these values for the study area, a value was arbitrarily chosen after considering that: 1) some initial amount of this infiltration is incorporated permanently into a very dry unsaturated zone; 2) some desert plants likely use some of this infiltration even if discharged below the commonly assumed base of the root zone; and 3) upward gradients for water vapor can exist in arid unsaturated zones.
- Value assumed in report: 80%
Alluvial aquifer
- City of Kingman, community water supplier (CWS), and industrial pumping (acre-ft/yr; afy) — Annual withdrawal data (2007 and 2008) were obtained primarily from reports submitted to the Arizona Corporation Commission. Uncertainty is caused by inaccurate flowmeters and possibly incomplete or erroneous reporting.
- Self-supplied domestic (SSD) pumping (acre-ft/yr; afy) — This value was estimated indirectly by using population data, as these residents own small private wells with withdrawals that are neither measured nor reported. The magnitude is small in all three valleys, but is uncertain because of the indirect method by which it was calculated.
- Interbasin transfer in or out (acre-ft/yr; afy) — Some water withdrawn by the City of Kingman from Hualapai Valley is transferred to Sacramento Valley to satisfy water demand, and was calculated by dividing groundwater-withdrawal values between the valleys on the basis of City of Kingman population distribution between the two valleys. The amount calculated with this method is consistent with the value estimated for it by the municipal utility.
Human water use and treatment
- City of Kingman and CWS water-supply pipe leakage (annual percent) — This was calculated as the difference between volume of groundwater withdrawn and volume of water billed as being delivered to customers. Uncertainty is caused by inaccurate flowmeters on wells, inaccurate flowmeters at customer-delivery points, and unbilled usage such as firefighting and filling of municipal swimming pools.
- Domestic consumptive water use (annual percent) — This was calculated for domestic water uses within the study area by using the winter base-rate method, which is described in another report. The largest source of uncertainty for this value in the study area may well be part-year residents, who likely use more water in the winter than summer; such activity would cause this value to be underestimated by the winter base-rate method.
- Industrial consumptive water use (annual percent) — A value of 100 percent for this was considered reasonable because more than 90 percent of industrial water use in the study area was for thermoelectric power generation, a process that ultimately evaporates all water either through cooling towers or evaporation ponds.
- Value assumed in report: 100%
- City of Kingman residents that discharge municipal water to septic tank (percent) — This value was calculated by comparing the volume of unconsumed water calculated as being produced in City of Kingman with the volume of water reported as being treated by WWTPs. It was consistent with an estimate provided by the municipal utility.
- Evapotranspiraiton from wetlands associated with WWTPs (annual percent) — This was calculated by considering the relative volume of effluent treated in each month, and the likely amount of ET in each of those months because of seasonal effects.
Other Key Assumptions
- Natural recharge and natural discharge are equal, meaning that groundwater withdrawals by pumping have not (yet) affected either one.
- Corollary: To date, groundwater withdrawals have derived all water from depletion of groundwater storage.
- This assumption is considered reasonable for the purposes of this water budget, but a groundwater-flow model would be needed to address this in more detail.
- No precipitation that falls on the floors of the alluvial basins becomes recharge.
- The period 1940-2008 adequately represents long-term average recharge conditions.
- Open-water evaporation from stream channels is negligible; all ephemeral runoff infiltrates the unsaturated zone.
- Leakage from water-supply pipes of self-supplied domestic and industrial water users is negligible.
- Stormflow leakage into sewer systems is negligible.
- Evaporation of water directly from septic systems is negligible.
- There is no perennial streamflow on the alluvial valley floors.
- Downward or lateral groundwater discharge through bedrock is negligible.
- Interbasin water transferred into Sacramento valley from Hualapai valley is entirely for municipal/domestic use.
- Interbasin water from Hualapai Valley only leaks from water-supply pipes in Sacramento valley.
- City of Kingman population served by the municipal utility is equal to the census "urban" population.
- All increased summertime domestic water use is associated with 100 percent consumptive-use activities.
- Domestic consumptive use is minimal in the winter.
- Leakage from water-supply pipes is entirely in the unsaturated zone.
- Nonconsumptive use remains constant throughout the year.
- Natural recharge was unaffected by human activity during 1940-2008.
- Withdrawal rates in 2007-08 were not affected by unusually high or low precipitation amounts.
- The winter base-rate method is appropriate for use in this study area.
Technical Information
These interactive figures were tested in the following web browsers: Internet Explorer, Firefox, Google Chrome, and Safari. The versions used were those commonly available in 2011. The figures rely on a standards-complaint XHTML 1.0 engine, and an ECMA-262 5th-edition-compliant JavaScript engine. Because the World Wide Web changes rapidly, these figures may require revision to function correctly on future computing platforms.
For those interested in changing in water-budget parameters outside of the definted limits, all files can be downloaded and run without an internet connection:
- Detrital.html
- Hualapai.html
- Sacramento.html
- modelDescriptors.js — this is where parameters and their values are defined
- images/arrowDown.png
- images/arrowLeft.png
- images/arrowRight.png
- images/arrowUp.png
- styles/accordion.css
- styles/common.css
- styles/custom.css
- styles/style.css
- lib/Wb/Descriptor.js
- lib/Wb/Model.js
- lib/Wb/Presenter.js
- lib/Wb/View.js
- lib/Wb/Model/Architect.js
- lib/Wb/Model/Conveyance.js
- lib/Wb/Model/Engine.js
- lib/Wb/Model/Parm.js
- lib/Wb/Model/Reservoir.js
- lib/Wb/Ui/Arrow.js
- lib/Wb/Ui/Parmslider.js
- lib/Wb/Ui/Resbox.js
- lib/accordion/accordion.js — by Brian Crescimanno, under Creative Commons Attribution-Share Alike 3.0 license
- lib/accordion/accordion.css
- lib/bubbleTooltip/bubbleTooltip.js — by Alessandro Fulciniti
- lib/bubbleTooltip/bubbleTooltip.css
- lib/bubbleTooltip/bubbleTooltip_bg.gif
- lib/prototype/prototype.js — by Sam Stephenson, under MIT-style license
- lib/scriptaculous/accordion.js — by Thomas Fuchs, unrestricted license
- lib/scriptaculous/builder.js
- lib/scriptaculous/controls.js
- lib/scriptaculous/dragdrop.js
- lib/scriptaculous/effects.js
- lib/scriptaculous/scriptaculous.js
- lib/scriptaculous/slider.js
- lib/scriptaculous/sound.js


