Scientific Investigations Report 2012–5017
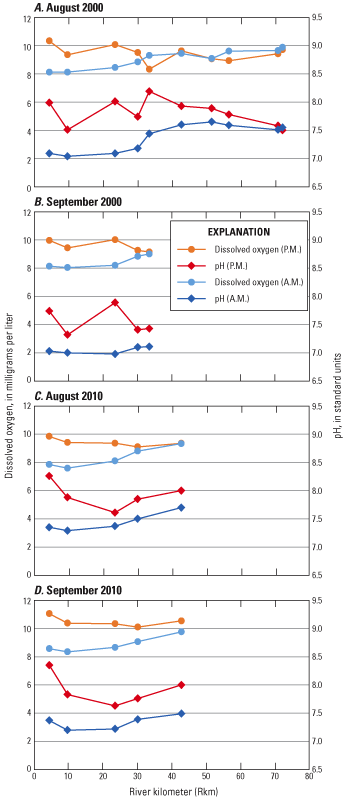
Figure 26. Concentrations of dissolved oxygen and pH levels in the Molalla River, Oregon in (A) August 2000, (B) September 2000, (C) August 2010, and (D) September 2010. |
First posted February 29, 2012 For additional information contact: Part or all of this report is presented in Portable Document Format (PDF); the latest version of Adobe Reader or similar software is required to view it. Download the latest version of Adobe Reader, free of charge. |

![]() U.S. Department of the Interior |
U.S. Geological Survey
U.S. Department of the Interior |
U.S. Geological Survey
URL: http://pubsdata.usgs.gov/pubs/sir/2012/5017/figure26.html
Page Contact Information: GS Pubs Web Contact
Page Last Modified: Thursday, 10-Jan-2013 19:47:12 EST
