Scientific Investigations Report 2012–5021
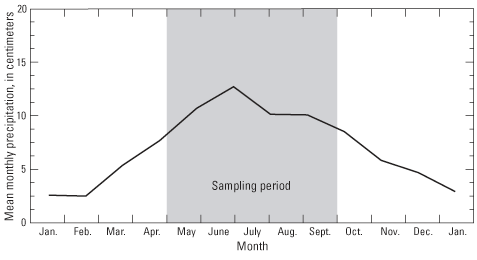
Figure 6. Mean monthly precipitation at the Iowa atmospheric sampling sites. Data are from National Oceanic and Atmospheric Administration (2002b) 1931–2000 average for Iowa climatic region 5. |
First posted February 16, 2012 For additional information contact: Part or all of this report is presented in Portable Document Format (PDF); the latest version of Adobe Reader or similar software is required to view it. Download the latest version of Adobe Reader, free of charge. |

![]() U.S. Department of the Interior |
U.S. Geological Survey
U.S. Department of the Interior |
U.S. Geological Survey
URL: http://pubsdata.usgs.gov/pubs/sir/2012/5021/figure6.html
Page Contact Information: GS Pubs Web Contact
Page Last Modified: Thursday, 10-Jan-2013 19:46:19 EST
