Triangular Distribution Fit Spreadsheets
Explanation:
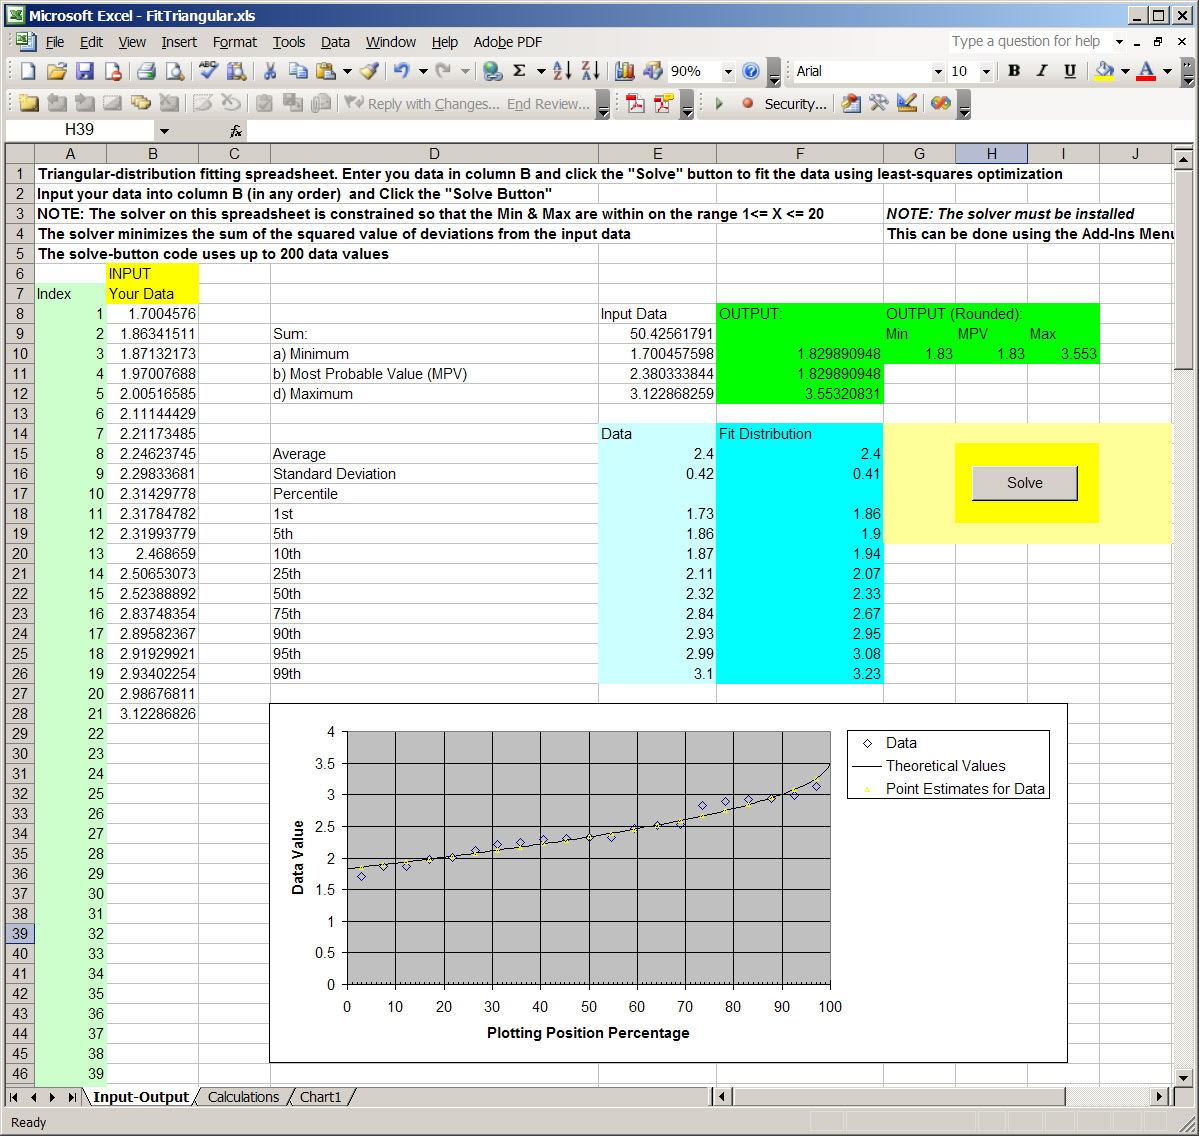
The final step for each selected streamgage is to fit the calculated recession ratios from the storms to a triangular distribution. This process is done to estimate values for the minimum, most probable value, and maximum recession ratios used by SELDM to generate a stochastic population of runoff-event durations. The Microsoft Excel Solver also is used to fit the sample of recession ratios to the distribution. The solver variables are set so that the minimum value must be greater than one. Recession ratios must be entered (or copied) into the worksheet labeled “Input-Output” in ascending order. The Microsoft Excel Solver is used on the worksheet labeled “Calculations” to find the best-fit minimum, MPV, and maximum values for a triangular distribution. These values are shown on the worksheet labeled “Input-Output” with summary statistics and percentiles for the input data and the best-fit triangular distribution. The spreadsheet developed for this purpose also has a graph labeled “Chart1” to show the relation between the input values and the theoretical triangular distribution with the calculated statistics.
Microsoft Excel templates for fitting data to a triangular distribution:
FitTriangular.xls This Microsoft Excel file can be used with Office 2003
FitTriangular.xlsm This Microsoft Excel Macro-Enabled Workbook file can be used with Office 2007
Note, to use the solver:
* It must be installed for use with Excel using the "Add-Ins" Menu
* It must be selected (with a check) in the visual basic editor reference window.
Screen shot showing the spreadsheet layout and command button: