Scientific Investigations Report 2012–5231

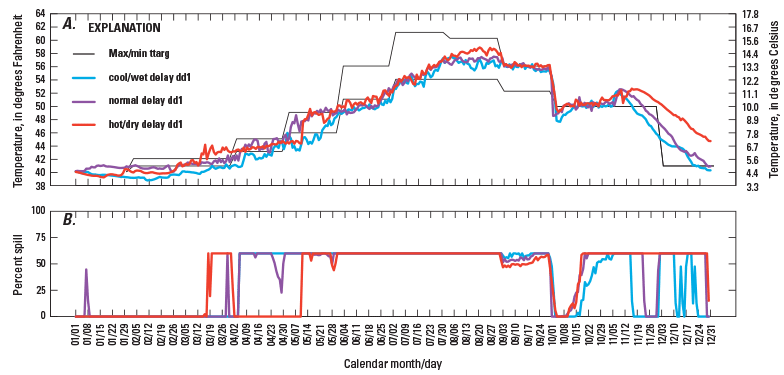
Figure 15. (A) Modeled water temperature and (B) percent spill for existing structural scenarios with delay_dd1 operational scenarios and max temperature targets (scenarios c6, n6, h6), North Santiam River, Oregon. The maximum and minimum temperature target established for the McKenzie River (labeled “Max/min ttarg”) is shown but only the maximum was used in this simulation. |
First posted October 30, 2012 For additional information contact: Part or all of this report is presented in Portable Document Format (PDF); the latest version of Adobe Reader or similar software is required to view it. Download the latest version of Adobe Reader, free of charge. |