Scientific Investigations Report 2013–5001
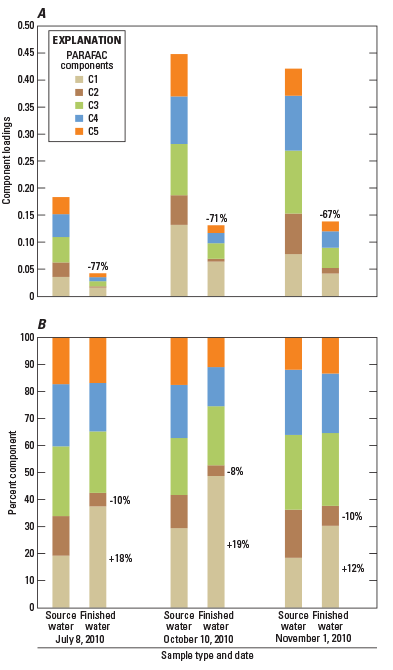
Figure 26. Effect of water treatment on (A) component loading, and (B) percentage of each component in source and finished water during July 2010 low flow, October 2010 initial storm, and November 2010 major-flush event at the Clackamas River Water drinking-water treatment plant, Clackamas River basin, Oregon. (Numbers show percent reduction in total fluorescence in (A), and the largest changes in selected component percentages in (B). See figure 21 for explanation of carbon components.) |
First posted February 11, 2013 For additional information contact: Part or all of this report is presented in Portable Document Format (PDF); the latest version of Adobe Reader or similar software is required to view it. Download the latest version of Adobe Reader, free of charge. |

![]() U.S. Department of the Interior |
U.S. Geological Survey
U.S. Department of the Interior |
U.S. Geological Survey
URL: http://pubsdata.usgs.gov/pubs/sir/2013/5001/figure26.html
Page Contact Information: GS Pubs Web Contact
Page Last Modified: Monday, 04-Feb-2013 12:49:35 EST
