Scientific Investigations Report 2013–5001
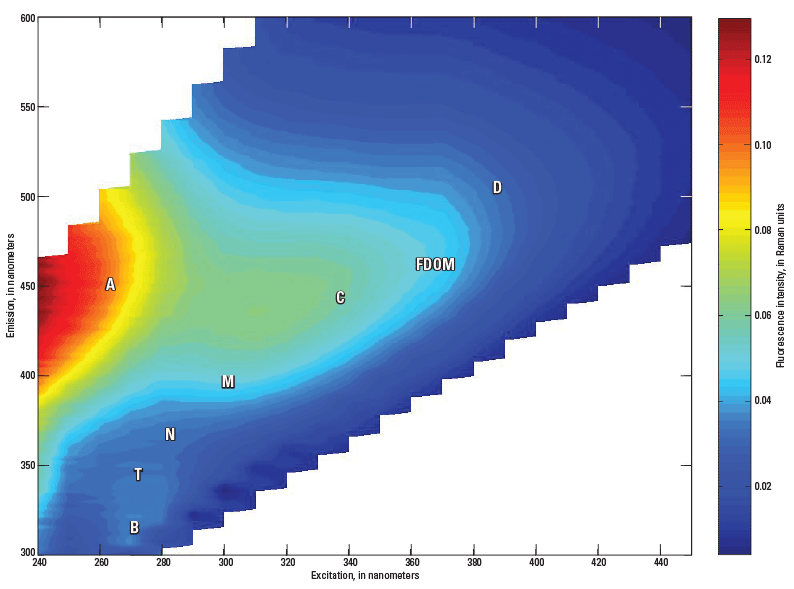
Figure 5. Example excitation–emission matrix showing the general locations of selected fluorescence peaks. (The contour plot is made up of 2,291 unique excitation-emission (ex/em) pairs. Individual letters indicate the location of common peaks associated with different pools of dissolved organic matter, which are described in figure 21. FDOM indicates the region measured with standard in-situ sensors. Example shown is from a source‑water sample collected from the Clackamas River Water DWTP on April 4, 2010.) |
First posted February 11, 2013 For additional information contact: Part or all of this report is presented in Portable Document Format (PDF); the latest version of Adobe Reader or similar software is required to view it. Download the latest version of Adobe Reader, free of charge. |

![]() U.S. Department of the Interior |
U.S. Geological Survey
U.S. Department of the Interior |
U.S. Geological Survey
URL: http://pubsdata.usgs.gov/pubs/sir/2013/5001/figure5.html
Page Contact Information: GS Pubs Web Contact
Page Last Modified: Monday, 04-Feb-2013 12:54:39 EST
