Scientific Investigations Report 2013–5016
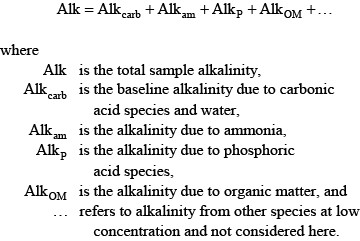
Enhanced pH Buffering and Nonconservative AlkalinityIn most freshwater systems, alkalinity is dominated by bicarbonate and carbonate; other constituents are either unimportant or have only a minor effect on alkalinity and the shape of the alkalinity titration curve (Hem, 1985; Stumm and Morgan, 1996; Rounds, 2006). In some systems, however, other constituents such as ammonia, organic matter, phosphoric acid, silicic acid, and boric acid, depending on their concentration, can have substantive acid/base properties. None of these other constituents were integrated into the default equations that the unmodified CE-QUAL-W2 model uses to calculate pH. Although neglecting such effects is appropriate for many natural waters, that approach may lead to significant errors in the prediction of pH under certain conditions. Dissolved organic matter, ammonia, and orthophosphorus at times are present in sufficiently large concentrations in the upper Klamath River to provide a substantial pH buffering capacity. For the purpose of modeling acid/base behavior, it was assumed that the orthophosphorus measured in the river could be represented by phosphoric acid and its conjugate bases. The necessity to include organic matter, ammonia, and phosphoric acid in the CE-QUAL-W2 pH equations and code was noted during the initial construction and calibration of the USGS upper Klamath River model (Sullivan and others, 2011), which recommended inclusion of these factors before pH calibration could be completed. Thus in this study, pH buffering effects of organic matter, ammonia, and phosphoric acid were incorporated into CE-QUAL-W2 for use in the upper Klamath River model. This required a review of the literature and modification of the CE-QUAL-W2 source code. Source code changes are documented in appendix B. In addition, previous versions of CE-QUAL-W2 have assumed that alkalinity is largely unaffected by chemical and biological reactions and responds only to changes in inputs and transport. While alkalinity is largely a conservative quantity, it is not entirely conservative. Reactions such as ammonia nitrification and nitrate denitrification, as well as photosynthesis and respiration, can have small effects on alkalinity. As a result of changes made to this version of CE-QUAL-W2, the user is allowed to specify whether alkalinity is to be simulated as a conservative or a nonconservative quantity. General Alkalinity EquationsAlkalinity is a measure of the amount of base that is present in a system relative to a reference solution of carbon dioxide in water. Alkalinity typically is measured through an acidimetric titration of a water sample and subsequent analysis to determine the final equivalence point (see Rounds, 2006, for USGS methods). Alkalinity can be divided into several components, depending on which acid/base constituents are included in its computation:
The alkalinity due to carbonic acid and water is straightforward to compute because alkalinity is defined as the excess base relative to a solution of carbon dioxide in water:
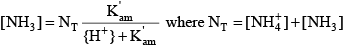
where the square brackets indicate concentrations of the various species in moles per liter, and alkalinity is in units of equivalents per liter. The derivation of the above equation can be found in many aquatic chemistry textbooks (Pankow, 1991; Stumm and Morgan, 1996; Drever, 1997). For ammonia, because the transition between the acid form (ammonium, NH
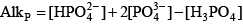
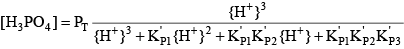
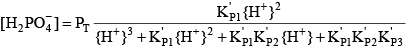
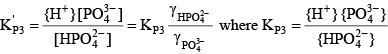
Phosphoric acid (H3PO4) is a triprotic acid that can exist in four forms, depending on the pH, if the various polyphosphate structures are neglected. When considering how to account for these species in an alkalinity computation, determining which of these species predominate at the pH of the final equivalence point of an alkalinity titration is necessary. Because the first and second acid dissociations of phosphoric acid occur near pH 2.1 and 7.2, it is reasonable to assume that H2PO
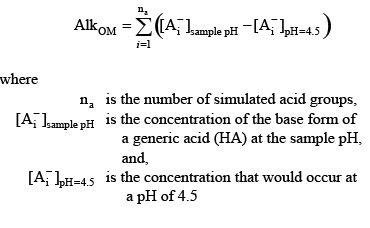
Finally, the contributions of organic matter to alkalinity must be included. This is not straightforward because natural organic matter consists of large, complex, and largely uncharacterized chemical structures that have multiple acid/base groups, including a range of carboxylic and phenolic groups of varying acidity. Many researchers have studied the acid/base properties of dissolved organic matter and found that those properties, while not characterized exactly, can be approximately represented through the use of a mixture of multiple simple acids or a distribution of acidities (Perdue and others, 1984; Gherini and others, 1985; Bonn and Fish, 1991; Tipping, 1994). However, many natural organic acids have acidities such that the acid group either would not be titrated or would only be partially titrated in a typical alkalinity titration. This complication can be resolved by assuming that the chemistry of carbonic acid dominates the sample near the final equivalence point, despite the presence of other acid/base species, and thereby is the predominant factor determining the equivalence point of the titration. Historically, many alkalinity titrations were deemed to be complete (at the equivalence point) when the sample had been titrated to a pH of 4.5. While this fixed-endpoint technique is no longer the primary method used by many organizations such as the USGS, it remains true that titrations of natural water samples typically result in an equivalence point in the pH range of 4.2–5.5. For all but the most dilute samples, the use of a pH 4.5 equivalence point normally results in only small percentage errors in the computed sample alkalinity. Assuming a pH 4.5 equivalence point also greatly simplifies the task of determining the contribution of organic matter to alkalinity:
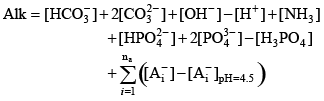
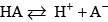
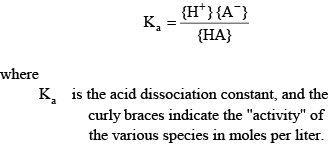
This concentration difference represents the amount of these bases that would be titrated in an alkalinity titration if that titration were terminated at pH 4.5, and therefore it is a reasonable estimate of the contribution of these acid groups to the sample alkalinity. Putting all of these terms together, the sample alkalinity can be represented as Acid Dissociation ChemistryThe alkalinity equation (7) can be written only as a function of acid dissociation constants and a few concentrations that are simulated by the CE-QUAL-W2 model. Consider a single monoprotic acid that dissociates and reassociates in the following reaction:
The acid dissociation constant for this reaction is defined as:
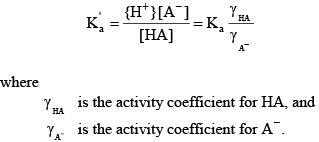
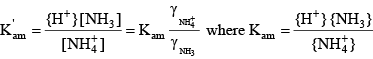
The activity of a species is approximately the same as its concentration in dilute freshwater samples. Activity corrections for more saline water can be handled through the definition of a mixed acid dissociation constant:
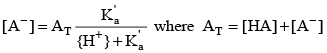
Knowing the value of the acid dissociation constant allows the concentration of A- to be written as a function of the total concentration of the acid and base forms of this constituent:
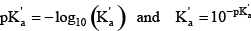
This equation can be rearranged after realizing that, just as pH = –log10{H +} and {H +}=10–pH,
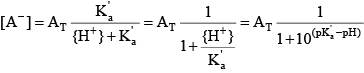
The concentration of A– then can be written in terms of pH and the acid group’s pKꞌa:
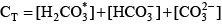
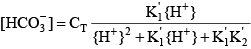
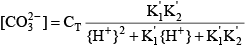
For organic matter that is represented as a mixture of monoprotic acids, this representation is particularly useful because it can be evaluated easily for both the sample pH and a pH of 4.5, which is the assumed pH of the endpoint of the alkalinity titration. For a diprotic acid such as carbonic acid, it is relatively simple to define similar functions. The total inorganic carbon concentration is given by:
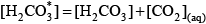
where the first term includes carbonic acid as well as dissolved carbon dioxide:
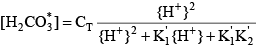
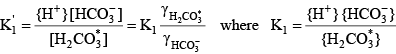
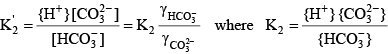
Mass balances as well as use of the acid dissociation constants reveal that:
where the acid dissociation constants of carbonic acid are given by:
Similar relations can be written for ammonia:
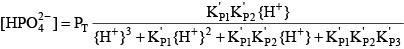
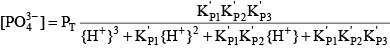
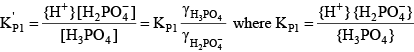
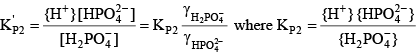
For phosphoric acid, the relevant equations are:
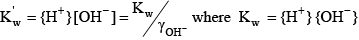
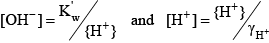
Finally, for water the acid dissociation constant and relevant equations are:
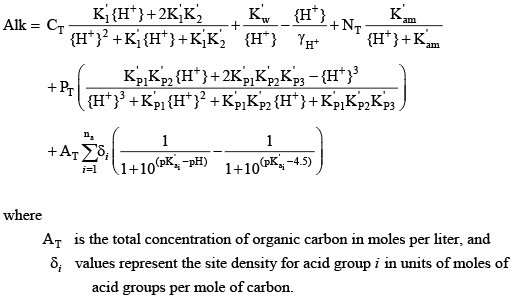
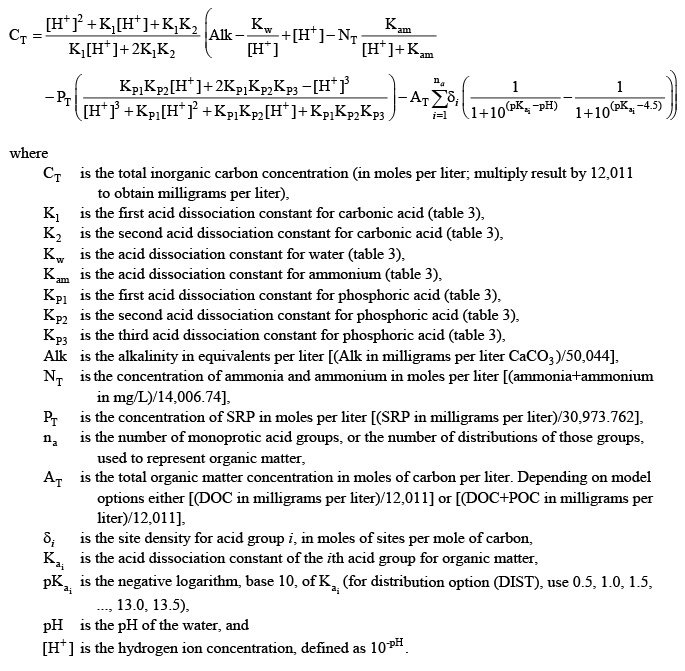
Final Equation of Alkalinity with Enhanced pH BufferingSubstituting relations for the various species concentrations into the master equation for sample alkalinity results in the following equation:
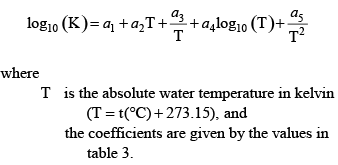
Without the enhanced buffering by ammonia, phosphoric acid, and organic matter, the equation would be far simpler, including only the terms before NT. Acid Dissociation Constants for Water, Carbonic Acid, Ammonium, and Phosphoric AcidThe acid dissociation constants for water, carbonic acid, ammonium, and phosphoric acid can be represented as a function of water temperature according to the following equation:
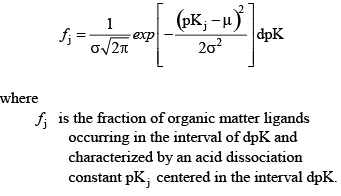
These equations generally predict the values of the various acid dissociation constants to within at least three significant digits relative to published measurements. Acid Dissociation Constants and Site Densities for Organic MatterWhen using the enhanced pH buffering modifications to CE-QUAL-W2 for organic matter, the model requires the user to provide the number of acid groups (na) used to represent the acid/base properties of the organic matter, the site density for each of those groups, and their pK values. The user can specify either an explicit mixture of monoprotic acids, or a Gaussian distribution of monoprotic acids that are characterized by a mean pK value and a standard deviation around that mean. The input options are described with the code modifications in appendix B. If the user specifies that a distribution of organic acid groups is to be used, then the model interprets the number of acid groups as the number of distributions to simulate. For example, the user could specify two groups, where one group is used to represent carboxylic acids with a mean pK of 4.5 and a standard deviation around that mean of 1.2, and a second group to represent phenolic groups with a mean pK of 9.6 and a standard deviation around that mean of 1.0. The model then constructs Gaussian distributions of those pK values from 0 to 14 and sums them together to assign a distribution of site densities. A Gaussian distribution of pK values with a mean μ and standard deviation σ is defined by the following equation:
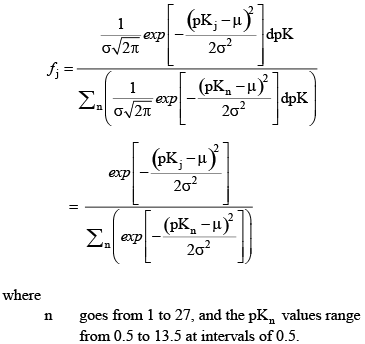
The model truncates this distribution by considering 27 pKj values from 0.5 to 13.5 at intervals of 0.5. To account for the truncation, the above equation is normalized such that:
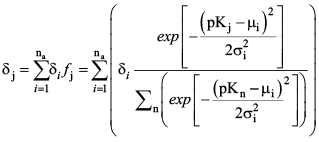
A truncated Gaussian distribution of these fractions is computed for each of the user-defined distributions (i = 1 to na), and those distributions are then summed to determine the final site density for the 27 simulated pKj values (fig. 4). The site density for each of the 27 acid groups, therefore, is:
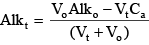
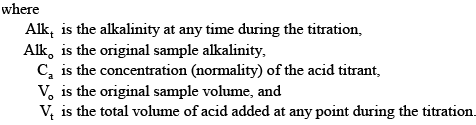
Theoretical Alkalinity Titration CurvesTheoretical alkalinity titration curves can be compared to measured titration curves to derive the number of organic acid groups and their site density and pKa values for use as model parameters. During an acidimetric titration, small increments of a known concentration of acid are added to the sample, and the pH after each addition is recorded. Each increment of acid decreases the alkalinity of the original sample until it becomes zero at the final equivalence point. A simple mass balance indicates that:
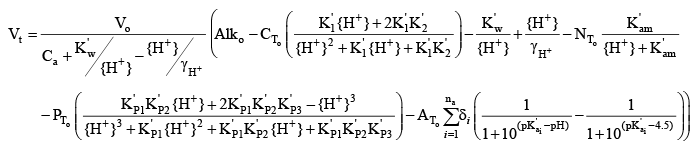
This equation can be combined with the equation for alkalinity above, using an assumption that the acid titrant does not include any carbonates, phosphates, ammonium, or organic matter, and then solved for the volume of acid added as a function of pH to produce a theoretical titration curve:
where the “o” subscripts on Alk, CT, NT, PT, and AT indicate the concentrations in the original sample prior to the beginning of the titration. If the concentrations of ammonia-plus-ammonium (NT), soluble reactive phosphorus (PT), and organic carbon (AT) in the original sample are known, then this theoretical titration curve can be used to fit a set of measured titration curves to determine the set of na, δi, and pKa values that best represent the contributions of organic matter to the sample alkalinity. Optimization of Organic Matter ParametersAn optimization program was written to find the set of site density and pK values for dissolved organic matter that provide the best fit for a set of 24 experimentally measured titration curves for water samples (0.45 µm filtered) collected from Link River, Klamath River at Miller Island (two depths), Klamath River at Keno (two depths), and the Klamath Strait Drain in June, July, August, and September 2007. Those samples also supported an investigation of biochemical oxygen demand in the Klamath River (Sullivan and others, 2010). Alkalinity titrations for these samples were performed according to USGS protocols (Rounds, 2006), and split samples were sent to the USGS National Water Quality Laboratory to determine the concentrations of ammonia-plus-ammonium and soluble reactive phosphorus. Split samples were sent to a USGS organic carbon laboratory in Boulder, Colorado for analysis of dissolved organic carbon concentrations. Titration curves were analyzed using the USGS Alkalinity Calculator (http://or.water.usgs.gov/alk/) to determine sample alkalinity; results from many samples included a warning message that the shape of the titration curve was not entirely consistent with the shape of a theoretical titration curve based only on the chemistry of carbonic acid. This suggested that some other constituent (other than hydroxide, bicarbonate, and carbonate) had acid/base properties and was being titrated. An iterative approach was implemented in which a set of site density and pK values was chosen, the total inorganic carbon concentration for each sample was computed using equation 42 provided below, and theoretical Vt values were computed for every pH in the experimental alkalinity titrations. The mean sum of squared differences between the experimental and theoretical Vt values was computed for each individual titration, and then the mean squared difference was computed for the set of all 24 titrations. Using that mean squared difference as an objective function to minimize, the optimization program utilized Powell’s conjugate direction-set method as described by Press and others (1989) to find the parameter values that provided the best fit to the experimental titration curves. Because the parameter space can include local minima for the objective function, an attempt was made to find the global minimum and therefore the best fit to the data by running the optimization program 100 times with a wide variety of randomized initial parameter values. Results from the 100 optimizations then were analyzed to determine the best set of parameter values. Two sets of optimizations were attempted. In the first, it was assumed that the acid groups associated with dissolved organic matter could be approximated with two Gaussian distributions of pKa values—one to represent carboxylic acid groups and one to represent phenolic or amine groups, after the method of Perdue and others (1984). The carboxylic group was likely to have a mean pKa in the range of 3.5–6, while the phenolic group was likely to have a mean pKa in the range of 9–11. Note that the algorithm programmed into CE-QUAL-W2 (see appendix B for code changes), as well as the algorithm used in the optimization routine, uses a truncated Gaussian distribution (0.5 ≤ pKa ≤ 13.5) and discretizes the distribution at 0.5 unit intervals; a smoother version could be used, but this coarser representation of the distribution should be adequate and is computationally faster. Setting na to 2, the optimization program was asked to find the best values for six parameters: two site densities, two mean pKa values, and a standard deviation about each of the two mean pKa values. After 100 optimizations with different initial conditions, the results yielded good information to set the mean pKa values to 5.50 and 9.74, but the standard deviation and site density for the phenolic group proved more difficult to optimize. The problem with characterizing the phenolic groups is that the experimental titration curves begin at the pH of the sample and then decrease as acid is added. The highest pH from the 24 samples was 9.58, making it impossible to know the shape of the experimental titration curve at higher pH values. To more accurately determine a distribution of phenolic pKa values, those higher pH values are needed. Perhaps future alkalinity titrations could be performed by first adding a known amount of base to increase the sample pH (and alkalinity) and thereby provide an experimental titration curve at the high end of the pH range, but this dataset lacked such data and therefore was insufficient to fully characterize the phenolic acid groups associated with dissolved organic matter. An additional titration curve with an initial sample pH of 10.78 was later tested with the optimized model parameters, and the agreement was good, but more titration curves with high pH are needed. When fitting a site density, mean pKa, and standard deviation about that pKa for the phenolic groups, it was found that the lack of high pH data in the titration curves meant that somewhat similar fits could be constructed using higher site densities along with a higher mean pKa and a wider distribution (larger standard deviation). In that way, just the lower tail of the pKa distribution was being used in the comparison of theoretical and experimental titration curves. Despite this problem, a best fit was found by using the mean pKa values from the initial 6-parameter optimization and following up with a 4-parameter optimization to find the best combination of site density and pKa standard deviation values that accompany those mean pKa inputs (table 4). The results indicated that the best-fit standard deviation values were quite small, around 0.05 units. This is somewhat counterintuitive, given what is known about the complex and variable structure of natural organic material and the accompanying range in acidities of its functional groups (Perdue and others, 1984; Bonn and Fish, 1991; Perdue and Ritchie, 2003). A more narrow distribution of acidities could be consistent with a single predominant source of dissolved organic matter to these samples. However, dissolved organic matter in the Klamath River system is likely to have multiple sources, such as wetlands, algae, or woody debris from historical and current mill operations. Further investigation into the sources of organic matter in the Klamath River system would help to better understand the variability of that material and its effect on pH buffering. A second optimization was designed to test whether two monoprotic acids with no distribution of associated acidities could be used to fit the organic-matter portion of the experimental titration curves. After all, with the rather small pKa standard deviations found in the first optimization, the fitted Gaussian distribution of pKa values was almost identical to just two monoprotic acids. In this second optimization, only four organic-matter parameters were fitted using the theoretical titration curve: two site densities and two pKa values. The results were quite similar to and slightly better than the results from the first optimization, with a mean absolute volume error of about 10.1 counts per titration (800 counts to 1 mL of acid volume). The mean absolute volume error from the first optimization (6 parameters) was about 10.2 counts per titration. Erring on the side of simplicity, it was decided to model the pH buffering of dissolved organic matter in the Klamath River using just two monoprotic acids and the parameters listed in table 4 for optimization #2. Although this is a simple approach, the resulting theoretical titration curves do a remarkably good job of fitting the experimental titration curves. Three examples from the 24 fitted datasets are shown in figures 5A, B, and C, in which the measured titration curves (points) are compared against four different theoretical titration curves. The simplest theoretical titration curve accounts only for the chemistry of carbonic acid and water, in which hydroxide, carbonate, and bicarbonate are the only entities that can be titrated. Successive theoretical curves then add the effects of ammonia, phosphates, and dissolved organic matter. In most of the Klamath River samples having a high pH, the carbonate-only theoretical titration curve failed to capture the shape of the measured titration curve, particularly for the higher-pH part of the curve. Adding in the effects of ammonia often helped when ammonia concentrations were high (close to or higher than 1.0 mg/L as nitrogen) and the sample pH was above 8.5. Phosphates rarely had a visible effect on the theoretical titration curve for the range of phosphate concentrations in these samples. Dissolved organic matter had a far more important and substantive effect on the theoretical titration curve for these samples and was instrumental in capturing the shape of the measured titration curve. Clearly, for these Klamath River samples, dissolved organic matter appears to be an important constituent that can buffer the pH of the river when algal blooms consume carbonic acid and force the pH to levels of 8 and above. Although the nature of the dissolved organic matter is likely to change over the course of a season and as a function of its various sources, representing its buffering with a pair of monoprotic acids in the model calculations appears to be a good first step in capturing that process. Recalculation of Boundary Conditions for Total Inorganic CarbonWith the inclusion of organic matter, orthophosphorus, and ammonia into the internal CE-QUAL-W2 calculations of pH, it is also necessary to adjust the concentration of total inorganic carbon in the model input files. Prior to the enhanced buffering updates, the concentration of total inorganic carbon for the inflows into the model was calculated from field measurements of pH, sample titrations to measure alkalinity, and an assumption that the alkalinity is predominantly due to bicarbonate, carbonate, and hydroxide. When that is the case, the alkalinity equation was simplified:
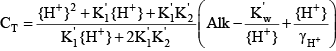
and the determination of the total inorganic carbon concentration was relatively straightforward once the values of the acid dissociation constants for carbonic acid are known:
Activating the enhanced pH buffering routines in CE-QUAL-W2 means that, to the extent that such enhanced buffering is important compared to that provided by bicarbonate and carbonate, the boundary condition total inorganic carbon concentration must be computed by taking into account the contributions of Alkam, AlkP, and AlkOM if those are activated in the model. Taking all three into account, the equation for CT becomes:
If neglecting activity corrections in a freshwater system, a slightly simpler equation results:
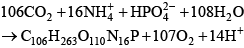
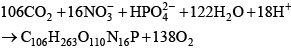
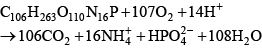
For organic matter, if the user chooses to represent the organic acids with a distribution of pK values, the details of the final distribution of pK values is needed. The ph_buffering.opt model output file from a test run with the organic matter inputs provides the overall site densities for a range of pK values to use with organic matter. The site density is the moles of acid/base groups per mole of carbon. For the distribution (DIST) option, 27 pK values from 0.5 to 13.5, at 0.5-unit increments, are used to characterize the final distribution and need to be accounted for in the calculation of CT. The calculation of total inorganic carbon concentrations from these equations can be used if the acid dissociation constants and site densities for organic matter have been determined, as in the upper Klamath River, or in different systems if the buffering provided by organic matter was smaller and could be ignored. It is best when simulating organic-matter buffering to analyze a series of alkalinity titration curves in advance of the modeling to estimate values for the organic matter site densities and pKa values. Otherwise, using these values as calibration parameters would require that the boundary conditions for CT be recomputed whenever the organic-matter parameter values that affect pH buffering are modified. Activity CorrectionsThe PH_CO2 subroutine in CE-QUAL-W2 (appendix B) includes activity correction calculations for most of the inorganic constituents included in the computations. Most of that code was left unchanged in this version, with the exception that some additional constituents not included in the default implementation were given activity corrections. Ionic strength was estimated in the default code based on simulated values of total dissolved solids or salinity. A form of the extended Debye-Hückel equation was used in the default code to estimate activity coefficients for bicarbonate, carbonate, hydroxide, and the hydrogen ion (H+). In this version, additional activity coefficients were computed for ammonia, ammonium, and the various phosphate species based on the existing equations and a set of ion size and charge factors tabulated for the Debye-Hückel equation by Stumm and Morgan (1996). Nonconservative AlkalinityPrevious versions of CE-QUAL-W2 assumed that alkalinity is largely unaffected by chemical and biological reactions and responds only to changes in inputs, transport, and mixing. While alkalinity is largely a conservative quantity, it is not entirely conservative. Reactions such as ammonia nitrification and nitrate denitrification as well as photosynthesis and respiration can have small effects on alkalinity. A summary of these effects was provided by Stumm and Morgan (1996) in their aquatic chemistry text (see table 4.5, page 173). The following reactions have effects on alkalinity:
As a result of changes made in this version of CE-QUAL-W2, the user is allowed to specify whether alkalinity is to be simulated as a conservative or a nonconservative quantity (see appendix B). |
First posted March 1, 2013 For additional information contact: Part or all of this report is presented in Portable Document Format (PDF); the latest version of Adobe Reader or similar software is required to view it. Download the latest version of Adobe Reader, free of charge. |

![]() U.S. Department of the Interior |
U.S. Geological Survey
U.S. Department of the Interior |
U.S. Geological Survey
URL: http://pubsdata.usgs.gov/pubs/sir/2013/5016/section5.html
Page Contact Information: GS Pubs Web Contact
Page Last Modified: Wednesday, 27-Feb-2013 13:42:28 EST

 (2)
(2)
 (3)
(3)
 (4)
(4)
 (5)
(5)
 (6)
(6)
 (7)
(7)
 (8)
(8)
 (9)
(9)
 (10)
(10)
 (11)
(11)
 (12)
(12)
 (13)
(13)
 (14)
(14)
 (15)
(15)
 (16)
(16)
 (17)
(17)  (18)
(18)  (19)
(19)  (20)
(20)  (21)
(21)  (22)
(22)  (23)
(23)  (24)
(24)  (25)
(25)  (26)
(26)  (27)
(27)  (28)
(28)  (29)
(29)  (30)
(30)  (31)
(31)  (32)
(32)  (33)
(33)  (34)
(34)
 (35)
(35)
 (36)
(36)
 (37)
(37)
 (38)
(38) 
 (39)
(39)  (40)
(40)
 (41)
(41)
 (42)
(42)  (43)
(43)