 Abstract
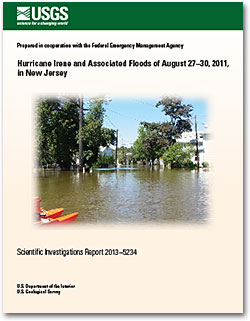
Intense rainfall from Hurricane Irene during August 27–30, 2011, inundated streams throughout New Jersey resulting in peak streamflows exceeding the 100-year recurrence interval at many streamgages and causing heavy property and road damage. The rain event affected the entire State. Some notably affected areas were the Passaic and Hackensack River Basins in northeastern New Jersey with new peaks of record at 10 continuous-record streamflow-gaging stations on streams such as the Hackensack River, Ramapo River, Rockaway River, and Green Pond Brook. In the Atlantic Coastal Basin, new peaks of record were recorded at 6 continuous-record streamflow-gaging stations, 2 of which were on the Manasquan River, 1 on Toms River, 1 on the Mullica River, 1 on the North Branch Metedeconk River, and 1 on the West Branch Wading River. Several tributaries to the Delaware River, such as the Pequest River, Flat Brook, and Assunpink Creek, also experienced major flooding with new peaks of record at nine continuous-record streamflow-gaging stations.
The U.S. Geological Survey (USGS) documented peak streamflows and water-surface elevations at 125 continuous-record streamflow-gaging stations, 27 crest-stage partial-record stations, and peak water-surface elevations at 24 continuous-record tide gages within the State of New Jersey. With rainfall totals averaging more than 10 inches throughout the State, peak-of-record flood elevations and streamflows occurred at 32 continuous-record streamflow-gaging stations. Flood-frequency recurrence-intervals were recomputed for 80 gages with 20 or more years of record; 25 crest-stage gages ranged from 25 years to greater than 500 years for the peak-of-record floods. The maximum peak streamflow per square mile ranged from 20 to 759 cubic feet per second per square mile.
The August 27–30, 2011, flood peaks rank as the peaks of record for 32 continuous-record streamflow-gaging stations with a period of record of 23 to 100 years, as the second highest peaks for 21 continuous-record streamflow-gaging stations with a period of record of 21 to 114 years, and the third highest peaks of record for 11 continuous-record streamflow-gaging stations with a period of record of 43 to 96 years. Several gages have documented peaks dating back to 1903.
About 1 million people across the State were evacuated, and every county was eventually declared a Federal disaster area. Property damage in New Jersey was estimated to be $1 billion. Governor Chris Christie declared a State of Emergency for New Jersey on August 31, 2011. After assessment of the damage by the Federal Emergency Management Agency, President Obama declared all 21 counties major disaster areas in the State of New Jersey on August 31, 2011.