 Abstract
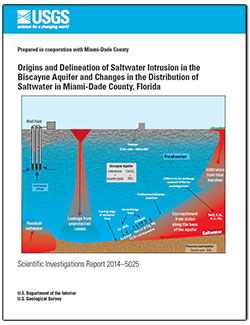
Intrusion of saltwater into parts of the shallow karst Biscayne aquifer is a major concern for the 2.5 million residents of Miami-Dade County that rely on this aquifer as their primary drinking water supply. Saltwater intrusion of this aquifer began when the Everglades were drained to provide dry land for urban development and agriculture. The reduction in water levels caused by this drainage, combined with periodic droughts, allowed saltwater to flow inland along the base of the aquifer and to seep directly into the aquifer from the canals. The approximate inland extent of saltwater was last mapped in 1995.
An examination of the inland extent of saltwater and the sources of saltwater in the aquifer was completed during 2008–2011 by using (1) all available salinity information, (2) time-series electromagnetic induction log datasets from 35 wells, (3) time-domain electromagnetic soundings collected at 79 locations, (4) a helicopter electromagnetic survey done during 2001 that was processed, calibrated, and published during the study, (5) cores and geophysical logs collected from 8 sites for stratigraphic analysis, (6) 8 new water-quality monitoring wells, and (7) analyses of 69 geochemical samples.
The results of the study indicate that as of 2011 approximately 1,200 square kilometers (km2) of the mainland part of the Biscayne aquifer were intruded by saltwater. The saltwater front was mapped farther inland than it was in 1995 in eight areas totaling about 24.1 km2. In many of these areas, analyses indicated that saltwater had encroached along the base of the aquifer. The saltwater front was mapped closer to the coast than it was in 1995 in four areas totaling approximately 6.2 km2. The changes in the mapped extent of saltwater resulted from improved spatial information, actual movement of the saltwater front, or a combination of both.
Salinity monitoring in some of the canals in Miami-Dade County between 1988 and 2010 indicated influxes of saltwater, with maximum salinities ranging from 1.4 to 32 practical salinity units (PSU) upstream of the salinity control structures. Time-series electromagnetic induction log data from monitoring wells G–3601, G–3608, and G–3701, located adjacent to the Biscayne, Snapper Creek, and Black Creek Canals, respectively, and upstream of the salinity control structures, indicated shallow influxes of conductive water in the aquifer that likely resulted from leakage of brackish water or saltwater from these canals. The determination that saltwater influxes were recent is supported by the similarity in the oxygen and hydrogen stable isotope composition in samples from the Snapper Creek Canal, 1.6 kilometers (km) inland of a salinity control structure, and in samples from well G–3608, which is adjacent to the canal, as well as by the relative ages of the water sampled from well G–3608 and other wells open to the aquifer below the saltwater interface. Historical and recent salinity information from the Card Sound Road Canal, monitoring well FKS8 located adjacent to the canal, and the 2001 helicopter electromagnetic survey indicated that saltwater may occasionally leak from this canal as far inland as 15 km. This leakage may be prevented or reduced by a salinity control structure that was installed in May 2010. Saltwater also may have leaked from the Princeton Canal.
Results of geochemical sampling and analysis indicate a close correspondence between droughts and saltwater intrusion. Tritium/helium-3 apparent (piston-flow) ages determined from samples of saltwater with chloride concentrations of about 1,000 milligrams per liter (mg/L) or greater generally corresponded to a period during which droughts were frequent. Comparison of average daily air temperatures in Miami, Florida, with estimates of recharge temperatures determined from the dissolved gas composition in water samples indicated that saltwater likely entered the aquifer in April or early May when water levels are typically at their lowest during the year. Conversely, most of the samples of freshwater with chloride concentrations less than about 1,000 mg/L indicate recharge temperatures corresponding to air temperatures in mid to late May when rainfall and water levels in the aquifer increase, and the piston-flow ages of these samples correspond to wet years. The piston-flow ages of freshwater samples generally were younger than ages of samples of saltwater.
Saltwater samples that were depleted in boron, magnesium, potassium, sodium, and sulfate, and enriched in calcium relative to the concentrations theoretically produced by freshwater/seawater mixing, generally were found to be associated with areas where saltwater had recently intruded. The calcium to (bicarbonate + sulfate) molar ratios (Ca/(HCO3+SO4)) of these samples generally were greater than 1. Saltwater samples from some of the monitoring wells, however, indicated little or no enrichment or depletion of these ions relative to the theoretical freshwater/seawater mixing line, and the Ca/(HCO3+SO4) molar ratios of these samples generally were less than 1. Results indicated that aquifer materials are approaching equilibrium with seawater at these well locations.

