 Abstract
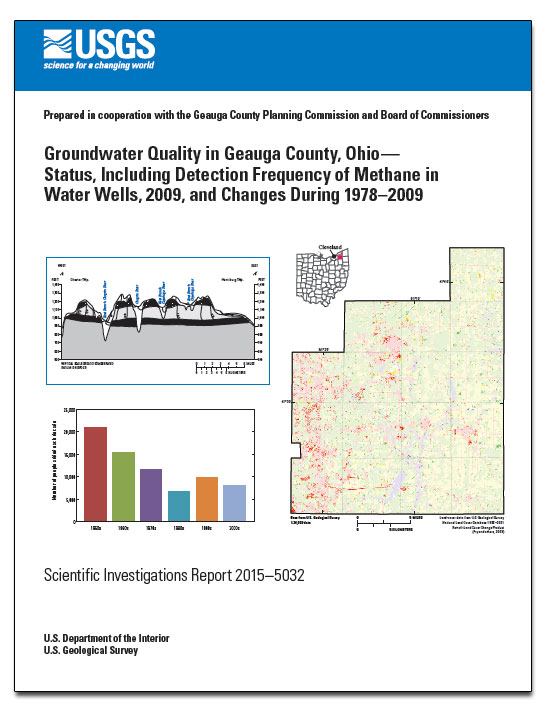
Domestic wells that are not safeguarded by regular water-quality testing provide drinking water for 79 percent of the residents of Geauga County, in northeastern Ohio. Since 1978, the U.S. Geological Survey (USGS) has worked cooperatively with the Board of Commissioners and Geauga County Planning Commission to monitor the quality of groundwater in four commonly used aquifers in county—the glacial deposits, the Pottsville Formation, the Cuyahoga Group, and the Berea Sandstone. A 33-percent growth in population from 1980 to 2009 increased the potential for humans to influence groundwater resources by withdrawing more groundwater, disposing of more human waste near the land surface, treating an expanded network of township roads with deicing salt, and likely using more solvents, pesticides, and other chemicals on the land surface than were used in preceding decades.
To describe the status of groundwater quality in 2009 and its suitability for drinking, USGS personnel collected samples of water prior to treatment from 16 wells (mostly domestic) during June 9–19. The samples were analyzed for 92 properties and constituents, 41 of which had human-health benchmarks to which analytical results could be compared to evaluate suitability for drinking. Four of these benchmarks were exceeded at the following frequencies: arsenic (2 of 16 wells, 12.5 percent), total coliform bacteria (2 of 16 wells, 12.5 percent), fecal coliform bacteria (1 of 14 wells, 7 percent), and sodium (6 of 16 wells, 38 percent). No domestic wells sampled in 2009 exceeded the health-based benchmark of 300 micrograms per liter (µg/L) for manganese, although 5 of 65 wells (8 percent) sampled since 1978 have. Analyses from domestic wells were augmented with water-quality data from seven public-supply well fields that were obtained from the Ohio Environmental Protection Agency. These public-supply data were typically collected between 2000 and 2010 and represent water samples that were collected prior to treatment or that were treated by a method that does not effectively remove the constituents of interest. Similar to the domestic-well data, these data indicated that some samples from public-supply wells have also exceeded health-based benchmarks for arsenic and sodium, along with occasional exceedances of health-based benchmarks for cadmium and lead. Concentrations of nitrate, pesticides, and volatile organic compounds in ground-water samples from domestic and (or) public-supply wells were either considerably less than the human-health benchmarks for these constituents or were not detected.
Water-quality data collected in 2009 were also compared to aesthetically based benchmarks developed by the U.S. Environmental Protection Agency, called Secondary Maximum Contaminant Levels (SMCLs). Iron and manganese most frequently exceeded SMCLs (in samples from 10 of 16 domestic wells and in untreated water from 3 of 4 public-supply well fields).
To evaluate the frequency of methane detection in water wells in the county, the USGS sampled 16 wells across the county and screened the samples for combustible gas within the headspace (the air above the water in a closed container). Water from three (19 percent) of the wells contained detectable combustible gas (0.10 to 0.40 percent by volume). All three detections were from wells tapping the Cuyahoga Group or the Berea Sandstone, and all detections were less than the lower explosive limit of 5 percent by volume—the concentration at which methane in air can be flammable if an ignition source is present. Analyses of dissolved gas composition in water from these three wells showed methane concentrations ranging from 0.007 to 1.8 milligrams per liter (mg/L).
The primary effect of human activities on groundwater quality found during this study is the input of salinity, or chloride, near land surface. On the basis of ratios of chloride to bromide, the main sources of chloride are road salt and septic leachate rather than oil-field brines (either spilled at land surface or sprayed on roads for dust control). The correlation of chloride concentration to distance of well from road for 31 wells in the county sampled by the U.S. Geological Survey in 1999 suggests that road salt is the dominant source of chloride.
The majority of constituents exceeding health-based and aesthetically based benchmarks in groundwater were those that are naturally present in aquifer rocks and sediments rather than constituents introduced by human activities. Concentrations of such natural contaminants are controlled by geochemical processes in the subsurface, particularly by oxidation-reduction (redox) reactions. The categorization of redox conditions based on the water quality of 116 samples collected from 65 wells in Geauga County during 1978 through 2009 indicates that most groundwater samples were strongly reducing (60 percent) or oxic (18 percent). Oxic waters were found only in the Pottsville Formation and Berea Sandstone and were generally associated with nitrate at concentrations of 0.38 to 6.0 mg/L. Strongly reducing waters occurred in all four commonly used aquifers and were associated with the following naturally occurring contaminants: (1) arsenic and manganese at concentrations exceeding the health-based benchmarks (10 µg/L and 300 µg/L, respectively) in some samples, (2) iron and manganese at concentrations exceeding the aesthetically based standards (300 µg/L and 50 µg/L, respectively) in most samples, and (3) total sulfides (consisting of hydrogen sulfide gas with its characteristic rotten-egg odor and [or] iron sulfide minerals that appear as finely disseminated particulates in water).
Because of the association of redox conditions with specific contaminants, attempts were made to further document spatially where oxic and strongly reducing conditions occur so that contaminant occurrence can be better anticipated by planners and well owners. Within the Pottsville Formation, wells tapping strongly reducing groundwater tended to have a greater thickness of overlying low-permeability (recharge-inhibiting) material such as clay and shale than other wells tapping oxic or nitrate-reducing groundwater. In the Berea Sandstone, oxic conditions were found at well locations where either depth to groundwater was shallow (less than 45 feet [ft] below land surface) or the measured water level was within the open interval (uncased portion) of the well, whereas strongly reducing groundwater was found at well locations where depths to water were greater than 60 ft below land surface and measured water levels were 15 ft or more above the open interval of the well.
To evaluate whether constituent concentrations consistently increased or decreased over time, the strength of the association between sampling year (time) and constituent concentration was statistically evaluated for 116 water-quality samples collected by the USGS in 1978, 1980, 1986, 1999, and 2009 from a total of 65 wells across the county (generally domestic wells or wells serving small businesses or churches). Results indicate that many of the constituents that have been analyzed for decades exhibited no consistent temporal trends at a statistically significant level (p-value less than 0.05); fluctuations in concentrations of these constituents represent natural variation in groundwater quality. Dissolved oxygen, calcium, and sulfate concentrations and chloride:bromide ratios increased over time in one or more aquifers, while pH and concentrations of bromide and dissolved organic carbon decreased over time. Detections of total coliform bacteria and nitrate did not become more frequent from 1986 to 2009, even though potential sources of these constituents, such as number of septic systems (linked to population) and percent developed land in the county, increased during this period.

