Geographic Analysis and Monitoring Program
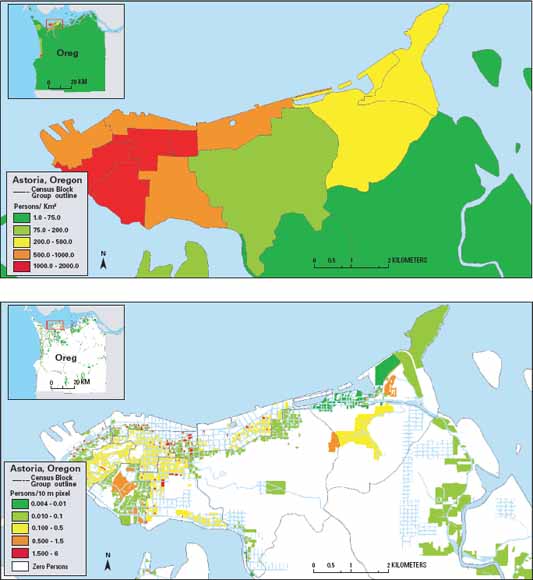
Choropleth map (top) and dasymetric map (bottom) of Astoria, Oregon (from figure 11).
The U.S. Census Bureau provides decadal demographic data collected at the household level and aggregated to larger enumeration units for anonymity purposes. Although this system is appropriate for the dissemination of large amounts of national demographic data, often the boundaries of the enumeration units do not reflect the distribution of the underlying statistical phenomena. Conventional mapping methods such as choropleth mapping, are primarily employed due to their ease of use. However, the analytical drawbacks of choropleth methods are well known ranging from (1) the artificial transition of population at the boundaries of mapping units to (2) the assumption that the phenomena is evenly distributed across the enumeration unit (when in actuality there can be significant variation). Many methods to map population distribution have been practiced in geographic information systems (GIS) and remote sensing fields. Many cartographers prefer dasymetric mapping to map population because of its ability to more accurately distribute data over geographic space. Similar to “choropleth maps”, a dasymetric map utilizes standardized data (for example, census data). However, rather than using arbitrary enumeration zones to symbolize population distribution, a dasymetric approach introduces ancillary information to redistribute the standardized data into zones relative to land use and land cover (LULC), taking into consideration actual changing densities within the boundaries of the enumeration unit. Thus, new zones are created that correlate to the function of the map, capturing spatial variations in population density. The transfer of data from census enumeration units to ancillary-driven homogenous zones is performed by a process called areal interpolation.
Download this report as a 22-page PDF file (tm11c2.pdf; 3.5 MB)
For questions about the content of this report, contact Rachel Sleeter
Download a free copy of the latest version of Adobe Reader.
|
Help |
PDF help |
Publications main page |
| Western Techniques and Methods |
| Geography | Geographic Analysis and Monitoring Program
|
This report is also available in print from:
USGS Information Services, Box 25286,
Federal Center, Denver, CO 80225
telephone: 888 ASK-USGS; e-mail: infoservices@usgs.gov

![]() U.S. Department of the Interior |
U.S. Geological Survey
U.S. Department of the Interior |
U.S. Geological Survey
URL: https://pubs.usgs.gov/tm/tm11c2/
Page Contact Information: Michael Diggles
Page Last Modified: May 2, 2008
