![]()
![]()
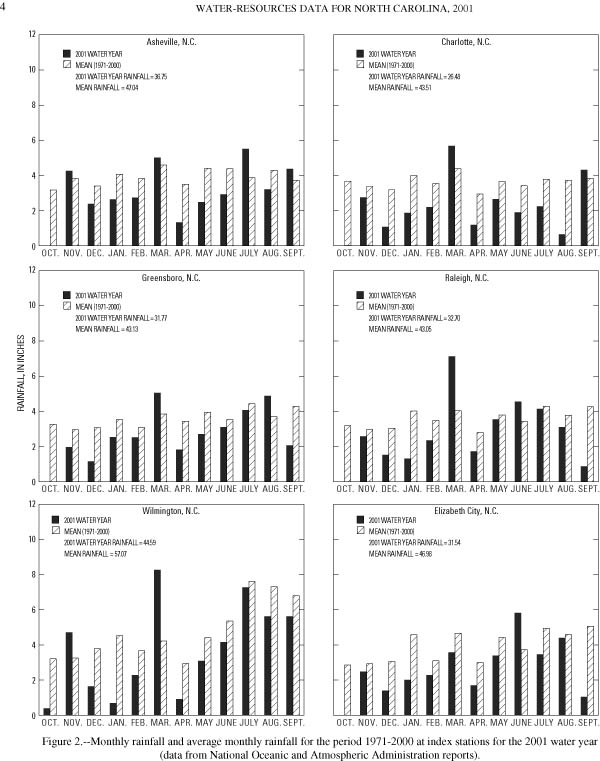
Precipitation
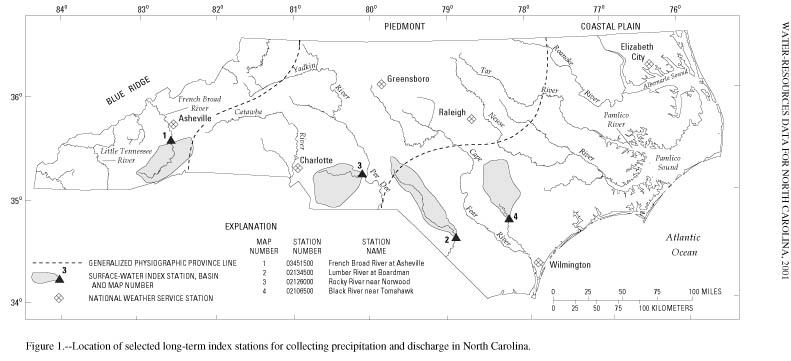
Precipitation amounts for the first quarter, October through December, of the 2001 water year were well below average across the State. Average precipitation amounts are mean monthly values based on data from 1971 through 2000, the 30-year base period used by the National Weather Service. Precipitation amounts varied from 3.76 (Asheville) and 6.38 (Charlotte) inches below average in the western part of the State, to 6.20 (Greensboro) and 5.11 (Raleigh) inches below average in the central part of the State to 4.98 (Elizabeth City) and 3.52 (Wilmington) inches below average in the eastern part of the State. All but one index site (Wilmington) recorded 0.00 inches to a trace of precipitation during the month of October. Asheville and Wilmington were the only locations to report above-average monthly precipitation amounts for the quarter; these amounts both occurred in November. Rainfall data collected at six key National Weather Service stations (figs. 1 JPG/PDF and 2 JPG/PDF) indicate that below-average rainfall amounts were recorded in all the Provinces of North Carolina.
The second quarter of the 2001 water year, January through March, brought continued drier conditions to the State. March was the only month during the quarter in which any of the index sites, with the exception of Elizabeth City, reported above-average precipitation amounts. All of the index sites reported below-average precipitation amounts for the quarter. The least rainfall was reported in Elizabeth City at 4.49 inches below average. Asheville, Charlotte, Greensboro, and Wilmington all reported rainfall from 0.40 to 2.20 inches below average.
The third quarter, April through June, again brought below-average amounts of rainfall across the State. Raleigh and Elizabeth City were the only locations to report above-average monthly rainfall, which both occurred in June. Quarterly precipitation amounts fell further below average during the third quarter at all the index sites across the State with the exception of Raleigh and Elizabeth City. Asheville was impacted the most by lack of rain, reporting 5.59 inches below average for the quarter. Charlotte, Greensboro, and Wilmington reported rainfall 3 inches less than average for the quarter.
During the fourth quarter, July through September, Asheville (1.18 inches) reported rainfall above average. The remaining index sites reported below-average conditions with departures ranging from 1.44 to 5.72 inches for the quarter; Charlotte (4.15 inches), Greensboro (1.44 inches), Raleigh (4.25 inches), Wilmington (3.22 inches), and Elizabeth City (5.72 inches).
In summary, the continued drought condition in North Carolina, which began in 1998, was worsened by below-average annual precipitation throughout the State. The National Weather Service reported below-average annual rainfall amounts at each of the six index sites. Asheville, in the southeastern part of the State, recovered somewhat from below-average rainfall amounts during the fourth quarter of the water year. The National Weather Service reported the following annual rainfall amounts for the 2001 water year at these selected stations: Asheville, 36.75 inches (10.29 inches below average); Charlotte, 26.48 inches (17.03 inches below average); Greensboro, 31.77 inches (11.36 inches below average); Raleigh, 32.70 inches (10.35 inches below average); Elizabeth City, 31.54 inches (15.44 inches below average); and Wilmington, 44.59 inches (12.48 inches below average).
Surface Water
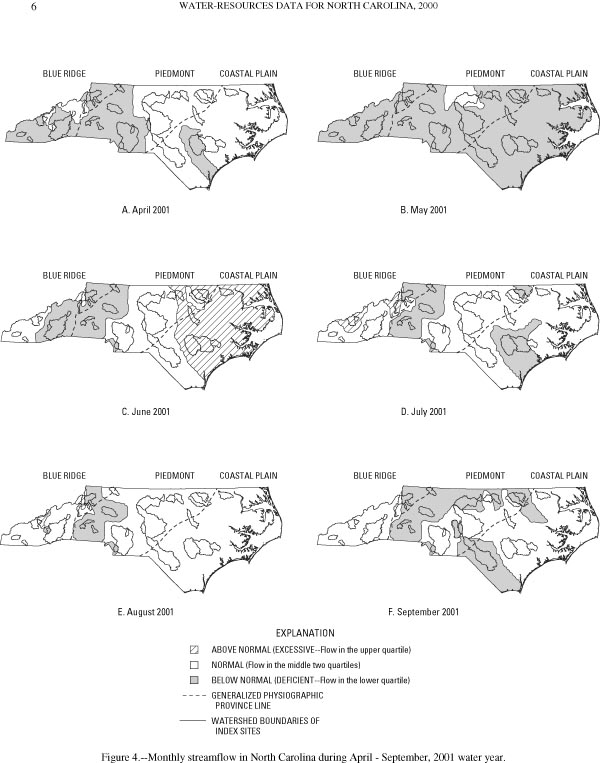
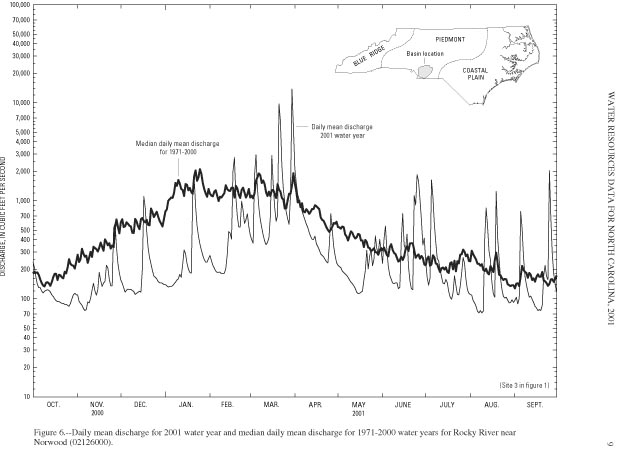
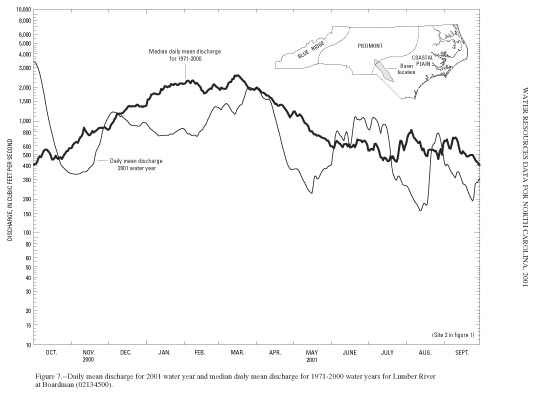
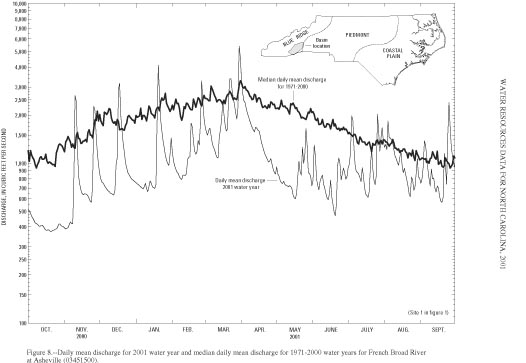
Streamflow conditions in North Carolina are influenced greatly by precipitation. Rainfall can produce rapid responses in streamflow. Streamflow also declines following periods of low rainfall. The rate and magnitude of decline depend on basin size, the season, evapotranspiration, and the amount of ground water in storage at the onset of the dry period. The effects on streamflow of variable rainfall in North Carolina during the 2001 water year are illustrated in figures 3-8 (fig 3 JPG/PDF, fig 4 JPG/PDF, fig 5 JPG/PDF, fig 6 JPG/PDF, fig 7 JPG/PDF, fig 8 JPG/PDF). Monthly conditions are depicted in maps (figs. 3 JPG/PDF and 4 JPG/PDF) that show the regions of above-normal, normal, and below-normal streamflow.
Data for the 30-year base period, 1971-2000, from 35 index gaging stations across the State were used to compute monthly flow statistics (figs. 3 JPG/PDF and 4 JPG/PDF). These stations are located on streams that are free of significant regulations or diversions and range in size from about 30 to 1,400 square miles. The descriptors, "above normal," "normal," and "below normal," refer to flow in the upper quartile, the middle two quartiles, and the lower quartile, respectively.
Monthly mean flows recorded at index stations during the 2001 water year were generally below normal. Sites reporting below-normal streamflow were evident each month of the water year. In fact, below-normal streamflow conditions were noted at more than half of the 35 index stations for October through February and April through May. All but one of the index stations recorded below-normal streamflow during the month of May (figs. 3 JPG/PDF and 4 JPG/PDF).
Record low monthly mean discharges were established at one or more index sites for every month except November, March, and July. Twelve sites experienced new record low monthly mean discharges for May. Record low annual mean discharges for the 2001 water year were also recorded at 13 of the 35 index sites (table 1).
| Station name | USGS station number | Years of record | Drainage area (square miles) |
Record low annual mean discharge for period of record (cubic feet per second) |
|---|---|---|---|---|
| Deep River at Moncure, N.C. | 02102000 | 72 | 1,434 | 531 |
| Yadkin River at Patterson, N.C. | 02111000 | 62 | 28.8 | 21.0 |
| Elk Creek at Elkville, N.C. | 02111180 | 36 | 48.1 | 35.7 |
| Fisher River near Copeland, N.C. | 02113000 | 70 | 128 | 80.2 |
| South Yadkin River near Mocksville, N.C. | 02118000 | 63 | 306 | 124 |
| Big Bear Creek near Richfield, N.C. | 02125000 | 48 | 55.6 | 18.2 |
| Rocky River near Norwood, N.C. | 02126000 | 72 | 1,372 | 446 |
| Little River near Star, N.C. | 02128000 | 48 | 106 | 32.1 |
| Henry Fork near Henry River, N.C. | 02143000 | 68 | 83.2 | 51.0 |
| Indian Creek near Laboratory, N.C. | 02143500 | 51 | 69.2 | 33.4 |
| Twelve Mile Creek near Waxhaw, N.C. | 02146900 | 41 | 76.5 | 15.5 |
| First Broad River near Casar, N.C. | 02152100 | 43 | 60.5 | 29.5 |
| South Fork New River near Jefferson, N.C. | 03161000 | 75 | 205 | 222 |
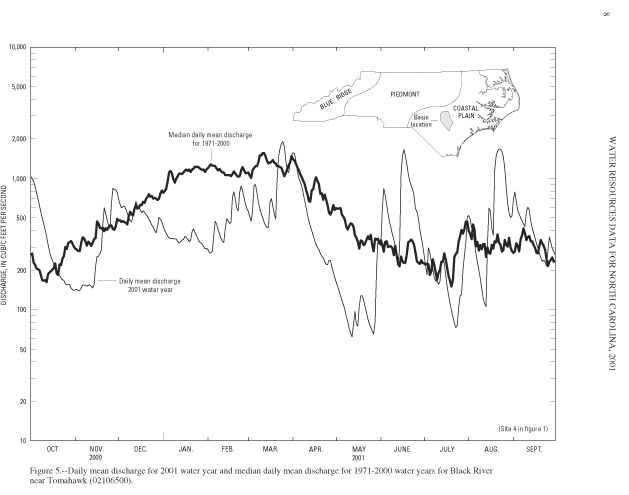
Responses of daily streamflow to basinwide weather patterns throughout the year at four long-term (1971-2000) index stations across the State (fig. 1 JPG/PDF) are shown in figures 5-8 (fig 5 JPG/PDF, fig 6 JPG/PDF, fig 7 JPG/PDF, fig 8 JPG/PDF). Monthly conditions are depicted in maps (figs. 3 JPG/PDF and 4 JPG/PDF). The daily mean discharge hydrograph for the 2001 water year is superimposed on the long-term median daily mean discharge hydrograph for each of these index stations. Daily mean discharge fluctuated both above and below the median daily mean discharge at the four sites but was generally less than the median for most of the 2001 water year.
In summary, below-average precipitation occurred during the 2001 water year throughout much of the State. Annual departure from normal precipitation totals for the six index weather stations were reported as follows: Asheville, 10.29 inches below average; Charlotte, 17.03 inches below average; Greensboro, 11.36 inches below average; Raleigh, 10.35 inches below average; Wilmington, 12.48 inches below average; Elizabeth City, 15.44 inches below average. Streamflow conditions reflected the rainfall pattern across the State, yielding below-normal streamflow conditions throughout much of the year.
![]()
Return to WY 2001 Annual Data Report Home Page
![]()