WRIR
00-4001
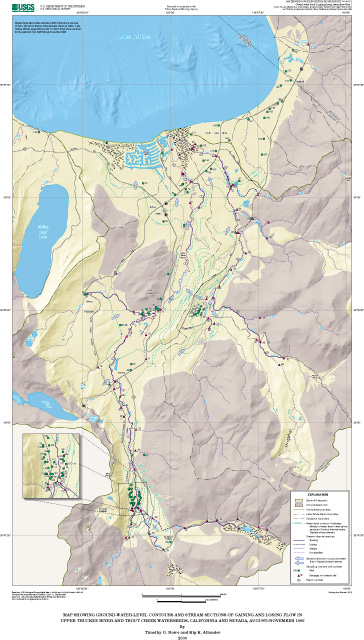
Surface- and Ground Water Characteristics in the Upper Truckee River and Trout
Creek Watersheds
|
Site no. |
Flow |
Specific |
Air |
Water |
Unit runoff |
|---|---|---|---|---|---|
Upper Truckee River watershed |
|||||
|
1 |
-- |
99 |
-- |
-- |
-- |
|
2 |
0 |
-- |
-- |
-- |
-- |
|
3 |
11.6 |
98 |
16.0 |
12.0 |
0.21 |
|
4 |
0 |
-- |
-- |
-- |
-- |
|
5 |
0 |
-- |
-- |
-- |
0 |
|
|
|
|
|
|
|
|
6 |
11.2 |
96 |
-- |
13.5 |
.21 |
|
7 |
10.1 |
98 |
14.0 |
12.0 |
-- |
|
8 |
0 |
-- |
-- |
-- |
-- |
|
9 |
10.3 |
98 |
18.5 |
11.5 |
.21 |
|
10 |
0 |
-- |
-- |
-- |
0 |
|
|
|
|
|
|
|
|
11 |
0 |
-- |
-- |
-- |
0 |
|
12 |
.8 |
72 |
14.5 |
6.5 |
.14 |
|
13 |
0 |
-- |
-- |
-- |
0 |
|
14 |
.2 |
39 |
3.5 |
4.5 |
-- |
|
15 |
10.4 |
99 |
18.5 |
12.0 |
-- |
|
|
|
|
|
|
|
|
16 |
.1 |
31 |
5.0 |
5.5 |
.06 |
|
17 |
8.5 |
91 |
14.5 |
9.5 |
.22 |
|
18 |
0 |
-- |
-- |
-- |
0 |
|
19 |
.1 |
148 |
15.5 |
9.0 |
.02 |
|
20 |
7.7 |
84 |
14.0 |
10.5 |
.23 |
|
|
|
|
|
|
|
|
21 |
0 |
-- |
-- |
-- |
0 |
|
22 |
0 |
-- |
-- |
-- |
0 |
|
23 |
0 |
-- |
-- |
-- |
0 |
|
24 |
0 |
-- |
-- |
-- |
0 |
|
25 |
6.4 |
75 |
20.0 |
11.0 |
-- |
|
|
|
|
|
|
|
|
26 |
0 |
-- |
-- |
-- |
0 |
|
27 |
.9 |
73 |
19.5 |
8.5 |
-- |
|
28 |
1.1 |
73 |
16.5 |
7.5 |
.31 |
|
29 |
-- |
-- |
-- |
-- |
-- |
|
30 |
2.6 |
65 |
18.5 |
8.5 |
-- |
|
|
|
|
|
|
|
|
31 |
.1 |
36 |
17.0 |
9.5 |
-- |
|
32 |
.3 |
43 |
17.5 |
7.5 |
-- |
|
33 |
.2 |
-- |
-- |
-- |
-- |
|
34 |
1.0 |
43 |
18.0 |
11.5 |
-- |
|
35 |
-- |
-- |
-- |
-- |
-- |
|
|
|
|
|
|
|
|
36 |
-- |
-- |
-- |
-- |
-- |
|
37 |
0.9 |
69 |
10.0 |
7.5 |
0.18 |
|
38 |
-- |
-- |
-- |
-- |
-- |
|
39 |
.5 |
50 |
18.5 |
8.0 |
-- |
|
40 |
0 |
-- |
-- |
-- |
0 |
|
|
|
|
|
|
|
|
41 |
0 |
-- |
-- |
-- |
-- |
|
42 |
0 |
-- |
-- |
-- |
-- |
|
43 |
3.1 |
51 |
10.0 |
6.0 |
.22 |
|
44 |
.6 |
50 |
14.5 |
7.0 |
-- |
|
45 |
2.6 |
50 |
25.0 |
9.0 |
-- |
Trout Creek watershed |
|||||
|
46 |
11.8 |
50 |
17.0 |
11.5 |
.56 |
|
47 |
8.4 |
50 |
15.5 |
10.5 |
-- |
|
48 |
2.8 |
50 |
15.5 |
11.5 |
-- |
|
49 |
22.6 |
50 |
14.0 |
7.0 |
.56 |
|
50 |
.2 |
52 |
20.5 |
7.0 |
.07 |
|
|
|
|
|
|
|
|
51 |
.4 |
50 |
11.0 |
7.0 |
-- |
|
52 |
20.6 |
52 |
-- |
10.5 |
.56 |
|
53 |
11.2 |
43 |
27.0 |
8.0 |
.88 |
|
54 |
11.3 |
44 |
30.0 |
7.0 |
-- |
|
55 |
0 |
-- |
-- |
-- |
0 |
|
|
|
|
|
|
|
|
56 |
-- |
-- |
-- |
-- |
-- |
|
57 |
10.8 |
54 |
14.5 |
10.5 |
.47 |
|
58 |
.1 |
92 |
17.0 |
9.0 |
-- |
|
59 |
.1 |
75 |
16.0 |
9.0 |
-- |
|
60 |
-- |
-- |
-- |
-- |
-- |
|
|
|
|
|
|
|
|
61 |
2.4 |
55 |
15.5 |
6.5 |
.29 |
|
62 |
2.5 |
46 |
19.0 |
7.5 |
-- |
|
63 |
.2 |
54 |
19.5 |
7.5 |
-- |
|
64 |
2.0 |
45 |
18.0 |
7.5 |
-- |
|
65 |
9.8 |
52 |
18.5 |
6.0 |
-- |
|
|
|
|
|
|
|
|
66 |
.8 |
51 |
18.0 |
7.0 |
.47 |
|
67 |
1.4 |
44 |
17.0 |
6.0 |
1.00 |
|
68 |
6.2 |
53 |
9.5 |
5.0 |
.84 |
|
69 |
1.0 |
54 |
11.5 |
6.0 |
.36 |
|
70 |
4.7 |
49 |
12.0 |
7.0 |
-- |
Table
of Contents
USGS Water home page || USGS
home page
The pathname for this page is <table3.htm>
These pages are maintained by S.C. DeMeo <email: scdemeo@usgs.gov>
Last modified: Wednesday, May 03, 2000