Figures
|
| Click image for a larger version. The
figures are also presented in PDF (pdf) or JPEG (jpg) format. If you have Adobe Acrobat Reader installed on your computer,
you may view and/or print the PDF version of these tables. If
you do not have Acrobat Reader, you may download it here.
|
 |
Cover Photograph: Headwaters of Daisy Creek in the New World Mining District near Yellowstone National Park, Montana. The McLaren Mine is on the right and Fisher Mountain is on the left in the background. View is upstream from sampling site 1,340 and shows the upstream, low-gradient part of the study reach. Photograph by J.H. Lambing, U.S. Geological Survey.
(click here for jpg file) |
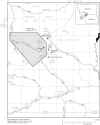 |
Figure 1. Location of New World Mining District and study area,
Montana. (click here for pdf
file) |
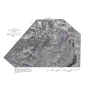 |
Figure 2a. Aerial photograph of the study area.
(click here for pdf) |
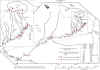 |
Figure 2b. Study area with tracer-monitoring sites,
synoptic-sampling sites, and monitoring well. Site names used in
previous studies were summarized by URS Operating Services, Inc.
(1998). Synoptic sampling site number corresponds to feet below
tracer-injection site. (click
here for pdf) |

|
Figure 3. Middle, high-gradient reach of Daisy Creek looking
downstream near site 7,324. Photograph by D.A. Nimick (click
here for jpg) |
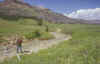 |
Figure 4. Downstream, low-gradient reach of Daisy Creek.
View is downstream near site 9,925. Stillwater River flows from left
to right in front of partly burnt forest. Photograph by D.A. Nimick
(click here for jpg) |
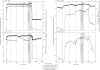 |
Figure 5. Temporal profiles of chloride concentration and specific
conductance at tracer-monitoring sites on Daisy Creek and the Stillwater
River, Montana, August 24-27, 1999. Temporal specific-conductance
data were not collected at site T-4. (click
here for pdf) |
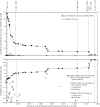 |
Figure 6. Chloride concentration (top) and streamflow (bottom) at
synoptic sampling sites in the Daisy Creek and Stillwater River drainage,
Montana, August 26, 1999. Chloride concentrations less than the
minimum reporting level (0.1 mg/L or 0.29 mg/L are plotted as one-half the
minimum reporting level. (click
here for pdf) |
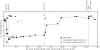 |
Figure 7. Values of pH in synoptic samples collected in the Daisy
Creek and Stillwater River drainage, Montana, August 26, 1999. (click
here for pdf) |
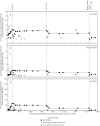 |
Figure 8. Concentrations of calcium, magnesium, and sulfate in
synoptic samples collected in the Daisy Creek and Stillwater River
drainage, August 26, 1999. (click
here for pdf) |
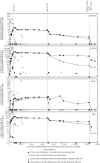 |
Figure 9. Concentrations of cadmium, copper, lead, and zinc in
synoptic samples collected in the Daisy Creek and Stillwater River
drainage, Montana, August 26, 1999. Values less than the minimum
reporting level (1 μg/L) are plotted as one-half the minimum reporting
level. (click here for pdf) |
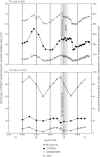 |
Figure 10. Diel variation in dissolved concentrations of copper,
manganese, and zinc in Daisy Creek (site 9,925, top) and the Stillwater
River (site 12,410, bottom) Montana, August 24-27, 1999. (click
here for pdf) |
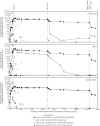 |
Figure 11. Concentrations of aluminum, iron, and manganese in
synoptic samples collected in the Daisy Creek and Stillwater River
drainage, Montana, August 26, 1999. (click
here for pdf) |
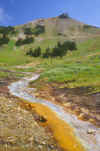 |
Figure 12. Aluminum and iron colloids in Daisy Creek. View
is upstream with surface-inflow site 481 on left side of stream.
Upstream of site 481, the pH of Daisy Creek is greater than about 4.5, and
white aluminum colloids form. Inflow (pH of 2.85) from site 481
decreases pH in Daisy Creek to less than 4.5, and only orange iron-oxyhydroxide
colloids form. (Photograph by J.H. Lambing, U.S. Geological Survey). (click
here for jpg) |
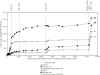 |
Figure 13. Downstream profiles of calcium and sulfate loads in
Daisy Creek and the Stillwater River, Montana, August 26, 1999. (click
here for pdf) |
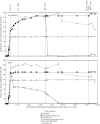 |
Figure 14. Downstream profiles of aluminum (top) and iron (bottom)
loads in Daisy Creek and the Stillwater River, Montana, August 26, 1999. (click
here for pdf) |
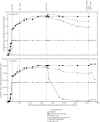 |
Figure 15. Downstream profiles of cadmium (top) and copper
(bottom) loads in Daisy Creek and the Stillwater River, Montana, August
26, 1999. (click here for pdf) |
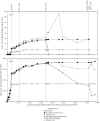 |
Figure 16. Downstream profiles of lead (top) and zinc (bottom)
loads in Daisy Creek and the Stillwater River, Montana, August 26, 1999. (click
here for pdf) |