Previous Section: Abstract
Next Section: Natural Factors Influence Chemical Indicators of Water Quality
Return to Table of Contents
Return to Home Page
The Midwestern Corn Belt is one of the most productive agricultural regions in the world. Nearly 80 percent of the Nation’s corn and soybeans is grown in the region. More than 6 million metric tons of nitrogen fertilizer and over 100,000 metric tons of pesticides are applied to cropland in the Midwest annually (Goolsby and others, 1993). The 1997 growing season produced the largest soybean crop and second-largest corn crop recorded in the Midwest.
The U.S. Geological Survey (USGS) National Water-Quality Assessment (NAWQA) Program conducted a water-quality study in the upper Midwest region during seasonally low-flow conditions in August 1997. Chemical and biological samples were collected from 70 streams and rivers in the Minnesota, Wapsipinicon, Cedar, Iowa, Skunk, and lower Illinois River basins of southern Minnesota, eastern Iowa, and western Illinois (fig. 1). Sampling locations were chosen to represent a range of soil-drainage conditions in stream basins and the percentage of trees in buffer zones along riparian segments. Census data from the U.S. Department of Agriculture (USDA) for 1997 were used in this study to quantify cropland, livestock, and chemical application in each basin. A complete description of the study design, methods, and data can be found in Sorenson and others (1999). This report summarizes significant results from the study and presents some implications for the design and interpretation of water-quality monitoring and assessment studies based on these results.
|
|
| Figure 1. Soil drainage in basins for the 70 streams and rivers sampled during August 1997 varied from very poor in the Western Lake physiographic section to moderately well drained in the Dissected Till Plains section. |
Differences in landscape terrain and soil characteristics among drainage basins in the upper Midwest region are associated with historical patterns of glacial advance and retreat. The spatial distribution of soils corresponds generally with physiographic sections (Fenneman and Johnson, 1946) in the upper Midwest region (fig. 1). For example, soils generally are moderately well drained in the Dissected Till Plains section of eastern Iowa, and the proportion of stream water that is derived from ground-water inflow is substantially greater than in adjacent sections (Winter and others, 1998). In contrast, soils with poor drainage, high runoff potential, and relatively higher organic nitrogen content are found in the Western Lake section of southern Minnesota and northern Iowa. Agricultural drainage systems (tiles and ditches) are prevalent throughout the study area. The USDA State Soil Geographic data base (STATSGO) was used to calculate Soil Hydrologic Group scores for each basin (Sorenson and others, 1999). Soil Hydrologic Groups are classified on the basis of drainage, runoff potential, permeability, depth to water table, and related characteristics. Stream basins with STATSGO scores of 2.6 or less were characterized as having “moderately well drained” soils; basins with scores exceeding 2.6, “poorly drained;” and basins with scores exceeding 3.0, “very poorly drained” (fig. 1).
 |
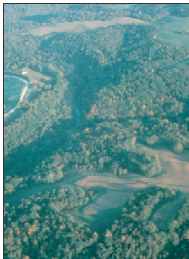 |
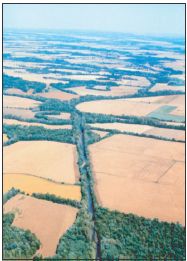
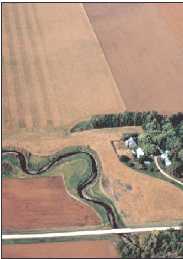
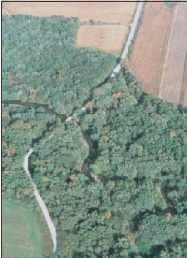
Resource agencies such as the USDA encourage maintenance of strips of trees or grass between agricultural fields and streams as a best management practice. These “riparian buffer zones” are thought to intercept runoff of sediment and chemicals from fields, promote bank stability, and provide shading and habitat for aquatic life (Osborne and Kovacic, 1993). For this study, riparian vegetation density, referred to hereinafter as “tree density,” was determined at two spatial scales: segment and reach. At the segment scale, tree density was classified based on the percentage of trees in a 100-meter-wide zone on each side of the stream for a distance of 2 to 3 miles upstream from the sampling location (Sorenson and others, 1999). Tree density was considered “low” if 35 percent or less of the area was forested and “high” if more than 35 percent was forested. At the reach scale (refer to Fitzpatrick and others, 1998), tree density was the percentage of the land surface covered by trees in replicate 20-square-meter vegetation plots along transects at the sampling location (Sorenson and others, 1999). Tree density was considered low if the percentage was less than 5 and high if 5 percent or more.
 |
 |
| AccessibilityFOIAPrivacyPolicies and Notices | |
 |
|