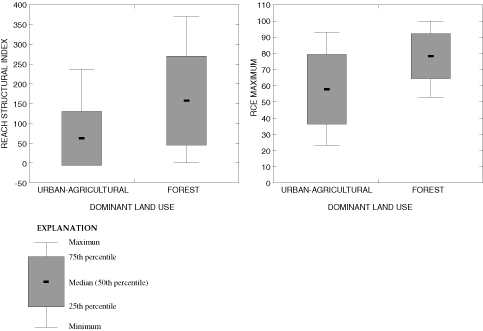
Figure 2. Distribution of selected stream-habitat variables for reaches grouped by dominant land use.
Back to Contents | Back to text | Figure 3