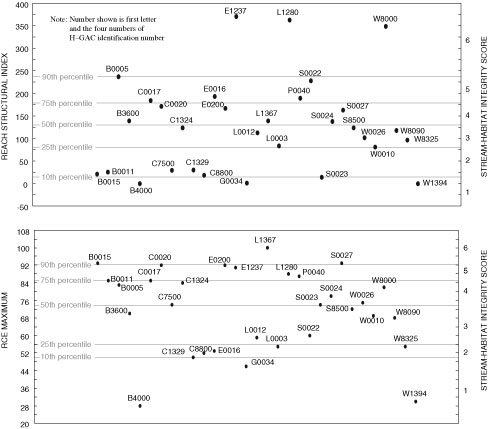
Figure 6. Reach structural index and RCE maximum for selected reaches classified by percentile and stream-habitat integrity score.
Back to Contents | Back to text | Figure 7