
Concentrations and annual fluxes for selected
water-quality constituents from the USGS National
Stream Quality Accounting Network (NASQAN),
1996-2000
By Valerie J. Kelly, Richard P. Hooper, Brent
T. Aulenbach, and Mary Janet
List of Figures and Tables
Figures
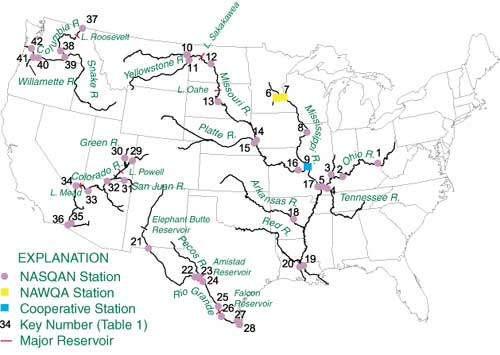
- Location of sampling stations and major reservoirs in NASQAN basins
- Hydrographs and samples collected at four NASQAN stations during water years 1996-2000
- Contamination, measured by blank detections only where they exceed twice the MRL, as percent of ambient data for nutrients, major ions, and trace elements for NASQAN data during 1996-2000
- Comparison of rank distribution for blank/ambient ratios, in percent, with associated ambient concentrations, only where blank concentrations exceed twice the MRL for ammonia-nitrogen and orthophosphate
- Comparison of rank distribution for blank/ambient ratios, in percent, with associated ambient concentrations, only where blank concentrations exceed twice the MRL for dissolved organic carbon and zinc
- Comparison of standard deviations for NASQAN ambient data and replicates for selected constituent groups
- Comparison of NASQAN sediment concentrations from various USGS District Sediment Laboratories and from the Georgia District Sediment Chemistry Laboratory
- Distribution of NASQAN field-spike recovery data for 1996-2000
- Comparison of sum of ambient pesticide concentrations; and field-spike recoveries, categorized by ambient concentration for individual pesticide constituents for NASQAN data, 1996-2000(/a>
Tables
- Sampling stations
- Water-quality stations descriptions