| Injection
site and number (Click on links below to see graphs) |
Sampling
site and number |
|||
| G–0 | G–1 | G–2 | ||
| S–0 | S–1 | S–2 | S–3 | S–4 |
| S–4 | S–5 | S–6 | ||
| H–0 | H–1 | H–2 | ||
| R–0 | R–1 | |||
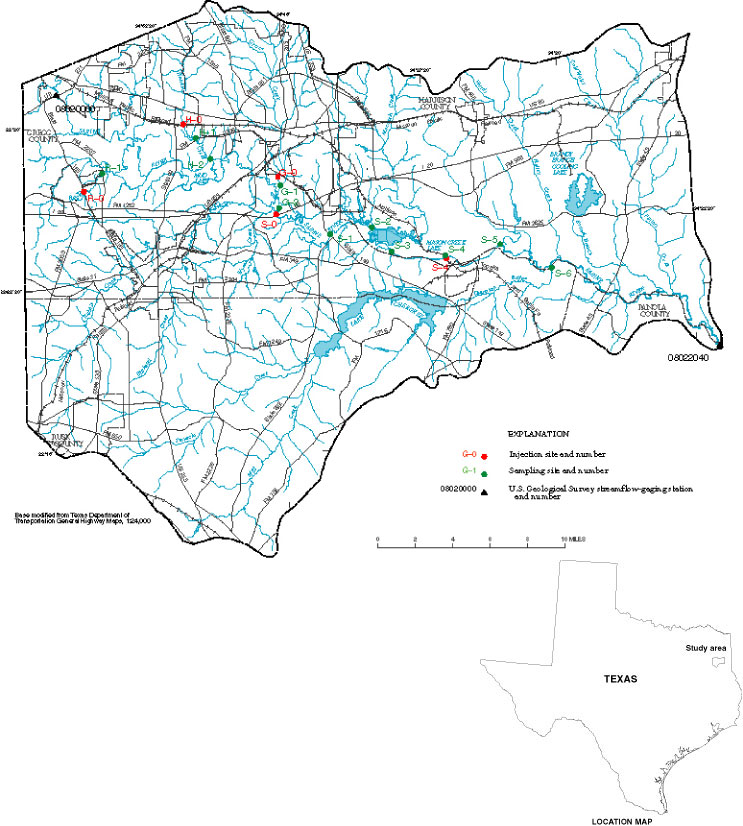
Map showing locations of injection and sampling sites and graphs showing time-concentration curves for sampling sites.
Back to Contents | Back to Text