Figure from
U.S. Geological Survey Water-Resources Investigations Report 98–4236
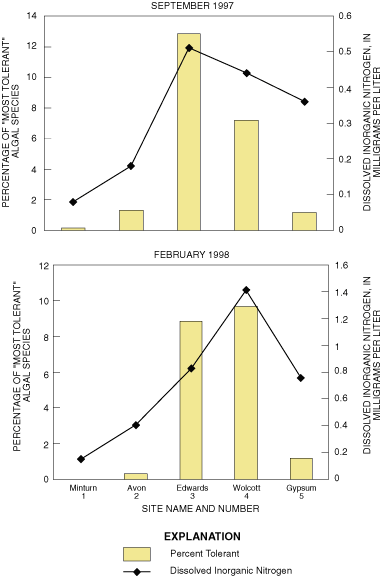
Fig
ure 8.
Comparison between the percentage of “most tolerant” taxa for algae and dissolved inorganic nitrogen (DIN).
Back