
___________________________________________________________________________________________________________________________________________
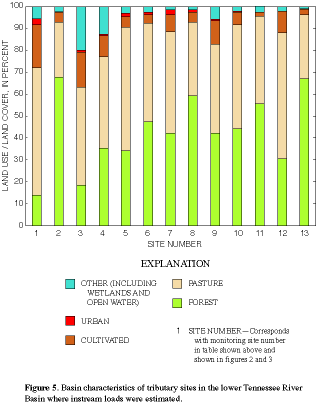
Percentage of basin area in subunit or land use/land cover
______________________________________________________________________________________________________
Subunit Land use/land cover
________________________________________________________________ _____________________________________
Plateau
Western Outer Inner Eastern Escarp- Agriculture
Site High- Nash- Nash- High- Cumber- ment _________________
number Coastal Tran- land ville ville land land and Culti-
(fig. 2) Surface-water station name Plain sition Rim Basin Basin Rim Plateau Valleys Forest Pasture vated Urban Other
____________________________________________________________________________________________________________________________________________
1 Clarks River at Almo, Ky. 95 0 5 0 0 0 0 0 14 58 20 3 5
2 Buffalo River near Flat Woods, Tenn. 0 1 99 0 0 0 0 0 68 25 4 0 3
3 Duck River below Manchester, Tenn. 0 0 0 1 0 99 0 0 18 45 16 1 20
4 Duck River below Normandy, Tenn. 0 0 0 34 0 65 0 0 35 42 9 1 13
5 Duck River at Williamsport, Tenn. 0 0 1 49 39 11 0 0 34 56 5 1 4
6 Duck River above Hurricane Mills, 0 0 34 36 24 7 0 0 47 45 4 1 3
Tenn.
7 Shoal Creek at Highway 43 near 0 0 100 0 0 0 0 0 42 46 8 2 2
Lawrenceburg, Tenn.
8 Shoal Creek at Iron City, Tenn. 0 1 99 0 0 0 0 0 59 34 4 1 2
9 Elk River below Tims Ford Dam, Tenn. 0 0 0 11 0 64 14 12 42 41 11 1 5
10 Elk River near Prospect, Tenn. 0 0 7 61 0 24 5 3 44 47 6 0 3
11 Flint Creek near Falkville, Ala. 0 0 0 0 0 14 0 85 56 40 2 0 2
12 Town Creek near Geraldine, Ala. 0 0 0 0 0 0 0 100 31 57 10 0 2
13 Sequatchie River at Valley Road, 0 0 0 0 0 0 64 36 67 29 2 0 2
Tenn.
____________________________________________________________________________________________________________________________________________
Printable PDF of colored graph available
| Title Page | Table of Contents | List of Illustrations | List of Tables | Conversion Factors and Vertical Datum | Glossary |