| ||||
Because the most recent eruptions in the Long Valley region occurred 250 to 600 years ago, no historical or instrumental records exist for the specific patterns of precursory activity that preceded previous eruptions in Long Valley Caldera or along the MonoInyo volcanic chain. Accordingly, the activity levels specified in table 2 for successive color codes are based on a combination of (1) patterns for premonitory activity to eruptions of wellmonitored volcanoes elsewhere in the world (see Decker, 1986; McClelland and others, 1989; McNutt, 2000; Newhall, 2000; Newhall and Dzurisin, 1988), (2) the multiple episodes of unrest in Long Valley Caldera thact followed the four M~6 earthquakes in May 1980 summarized under appendix A; and (3) a general understanding of the geophysical and geochemical processes associated with the intrusion of magma into the shallow crust prior to a volcanic eruption.
The intrusion of magma into the shallow crust generally can be detected instrumentally because relatively cold, hard rocks of the shallow crust must deform to accommodate the volume of intruding magma. Stresses associated with that deformation induce brittle failure (earthquakes) in the adjacent crust and warping of the overlying surface. The magma itself may produce detectable seismic waves as it flows through constrictions in a conduit or as a super-saturated, bubble-rich magma reverberates in magma-filled cracks. As magma ascends toward the surface, confining pressures due to the weight of overlying rocks decrease, allowing dissolved magmatic gasses (principally water vapor, carbon dioxide, and sulfur dioxide) to exolve and escape to the atmosphere through fractures in the crust well in advance of the rising magma. At sufficiently shallow depth, some of the heat contained in the magma will be transferred to the local ground water, which may induce a variety of changes in the hydrothermal system, including changes in water-table depths and temperatures. If the heat transfer is sufficiently rapid, shallow ground water may flash to steam generating phreatic (steam) explosions of the sort that produced the Inyo Craters at the southern end of the Inyo volcanic chain. A complete boil off of the hydrothermal system may allow sulfur dioxide (SO2) from the intruding magma body to escape to the atmosphere.
In general, these phenomena accompanying magmatic intrusions are rather pronounced in volcanic systems that erupt infrequently, such as Long Valley Caldera and the Mono-Inyo volcanic chain, where the uppermost 5 to 10 km of the crust is relatively cold and hard. They are often more subdued in the case of central-vent volcanoes that erupt relatively frequently, because the well-established and often-used magma conduit offers less resistance to a new batch of magma as it ascends toward the surface.
Seismicity and ground deformation in particular have long been recognized as the two most robust precursors to volcanic eruptions (Decker, 1986; Tilling, 1995). Major advances in the systematic, quantitative measurement of carbon dioxide (CO2) and SO2 over the past couple of decades, however, have clearly demonstrated that knowledge of the flux rates of these two important volcanic gasses can aid significantly in judging the likelihood that volcanic unrest will culminate in an eruption (Gerlach and others, 1996; McNutt and others, 2000; Young and others, 1998). Accordingly, the Color-Code criteria in table 2 are based on seismicity rates, ground deformation rates, and the mass flux of CO2 and SO2.
Available information on the preeruptive behavior of the Long Valley Caldera-Mono Craters volcanic system is currently inadequate to support robust statistical calculations for the probabilities that a specific activity level will culminate in an eruption within a specified time interval. The USGS recognizes, however, the importance of establishing meaningful probability estimates for each status and this remains a goal pending further advances in the understanding of pre-eruptive processes. In the meantime, the USGS will use the Color-Code scheme outlined in tables 1 and 2 to guide its response to future episodes of unrest within Long Valley Caldera and along the MonoInyo volcanic chain.
Although increased earthquake activity precedes nearly all volcanic eruptions, the intensity, duration, and style of the precursory seismicity vary considerably from one volcano to the next and even from one eruption to the next at a given volcano. Many earthquakes in volcanic systems result from abrupt brittle failure along faults or fractures similar to earthquakes in purely tectonic environments. Most restless or active volcanic systems also produce so-called "volcanic" earthquakes, which result from fluid dynamic processes associated with the transport of magmatic and associated hydrothermal fluids. Because of their close association with the transport of magmatic fluids, their associated volatiles, and heat, these "volcanic" earthquakes are particularly diagnostic as precursory signs to possible volcanic activity.
A consensus has yet to be reached in the scientific literature on the classification of seismic events occurring in areas of current or recent volcanism (Chouet, 1996; McNutt and others, 2000). In this response plan, the distinction is made between two broad groups of earthquakes-one with sources dominated by brittle failure and the other with sources dominated by fluid dynamic processes. Ordinary earthquakes resulting from brittle failure are common to both tectonic and active volcanic regimes. Earthquakes with sources dominated by fluid dynamic processes, however, are almost exclusively limited to active volcanic regimes and geothermal areas.
Earthquakes that result from brittle failure are most commonly referred to simply as ordinary "earthquakes." Such earthquakes in volcanic environments may be variously referred to as tectonic or volcano-tectonic (VT) earthquakes, high-frequency (HF) earthquakes, broad-band (BB) earthquakes, or A-type earthquakes. In this document we use the qualifier "high frequency" (HF) to distinguish ordinary earthquakes from long-period (LP) or very long period (VLP) volcanic earthquakes (see next section) when necessary. Whether differential stresses that lead to brittle failure and frictional slip are due to regional tectonic processes (tectonic earthquakes), local magmatic/volcanic processes, or some combination thereof (volcanotectonic earthquakes), the result is the same; abrupt slip of rock surfaces past one another along a fault plane producing the classic doublecouple radiation pattern. In some cases, particularly in volcanic and geothermal areas, brittle failure may also involve the abrupt opening of tensile cracks to produce nondouble-couple radiation patterns (Julian and others, 1998; Miller and others, 1998). HF earthquakes typically have clear P and S waves with substantial energy at frequencies above 10 Hz (fig. C1A). They radiate seismic energy over a broad frequency range with a flat spectrum at frequencies, f, below a corner frequency, fc and with spectral amplitudes that roll off as f-1 to f-3 for frequencies above the corner frequency (f>fc). Fluids may trigger brittle failure by, for example, reducing the effective frictional strength across a fault plane through increasing pore pressure, but the fluid phase does not directly contribute to the radiated seismic energy. The vast majority of earthquakes associated with the unrest in Long Valley Caldera and vicinity over the past two decades have been ordinary HF events.
Figure C1. Examples of seismograms recorded on Mammoth Mountain station MMPM (see fig. D1) (A) for a typical high-frequency (volcano tectonic) earthquake with a magnitude (M) =1.1 and (B) for the onset of a spasmodic burst (total duration was about 30 minutes). Both occurred beneath Mammoth Mountain during the 1989 earthquake swarm (from Hill and others, 1990).
"Rapidfire" bursts of small (generally M> or =2) HF earthquakes with overlapping coda (fig. C1B) are common in volcanic areas. These spasmodic bursts (sometimes called spasmodic tremor) typically have durations ranging from tens of seconds to 30 minutes or more. They frequently accompanied earthquake swarms beneath Long Valley Caldera's south moat in 1982 (Ryall and Ryall, 1983), and they were common during the 1989 swarm beneath Mammoth Mountain (Hill and others, 1990). Individual events within a spasmodic burst have the appearance of HF earthquakes, although the signal level between events may remain above background noise levels well beyond the decay times for waves from tectonic earthquakes of comparable size. The focal mechanisms determined for two of the larger events within a spasmodic burst beneath Mammoth Mountain on September 4, 1997, which was recorded on a temporary network of digital, three-component stations, have large isotropic components (volume increase) and rotational symmetry about the T-axis consistent with hydraulic fracturing of previously unbroken rock. As described in the following section, spasmodic bursts accompanied the very-long-period (VLP) earthquakes that occurred beneath Mammoth Mountain in October 1996 and July and August 2000. Spasmodic bursts rarely, if ever, occur in purely tectonic regimes. The process producing spasmodic bursts remains a topic of research, although currently available evidence strongly points to an association with fluid transport and hydraulic fracturing within the brittle crust.
Fluid dynamic processes driven by pressure and (or) temperature gradients associated with crustal magma may excite seismic waves by a variety of processes including resonances within fluid-filled cracks (Chouet, 1992) and unsteady, nonlinear flow along conduits with irregular geometry (Julian, 1994). The seismic waves generated by such processes typically produce earthquakes deficient in frequencies above 5 to 10 Hz and with extended coda that "ring" for many cycles at a nearly constant frequency (fig. C2). Spectra from seismograms of these earthquakes are typically comb-like with individual peaks showing a harmonic relation to a fundamental mode or a period-doubling relation characteristic of nonlinear systems (Julian, 1994). Such earthquakes are variously referred to as long-period (LP) earthquakes, low-frequency earthquakes, or B-type, volcanic earthquakes (Chouet, 1996; McNutt, 2000). The dominant frequencies for these volcanic earthquakes are typically in the range 1 to 5 Hz. At shallow depths (less than 5 km or 3 miles), LP earthquakes appear to involve the resonance of bubbly fluids in fluid-filled cracks associated with degassing or boiling (Chouet, 1992). At greater depths, non-steady fluid flow may be a more common process (Julian, 1994), although basaltic magmas may behave as a bubbly fluid at pressures typical of mid-crustal depths (10 to 20 km or 6 to 12 miles) with carbon dioxide as the gaseous phase. The deep LP earthquakes beneath Mammoth Mountain that began in late 1989, for example, may be associated with resonances within a basalt-carbon dioxide froth (Pitt and Hill, 1994).
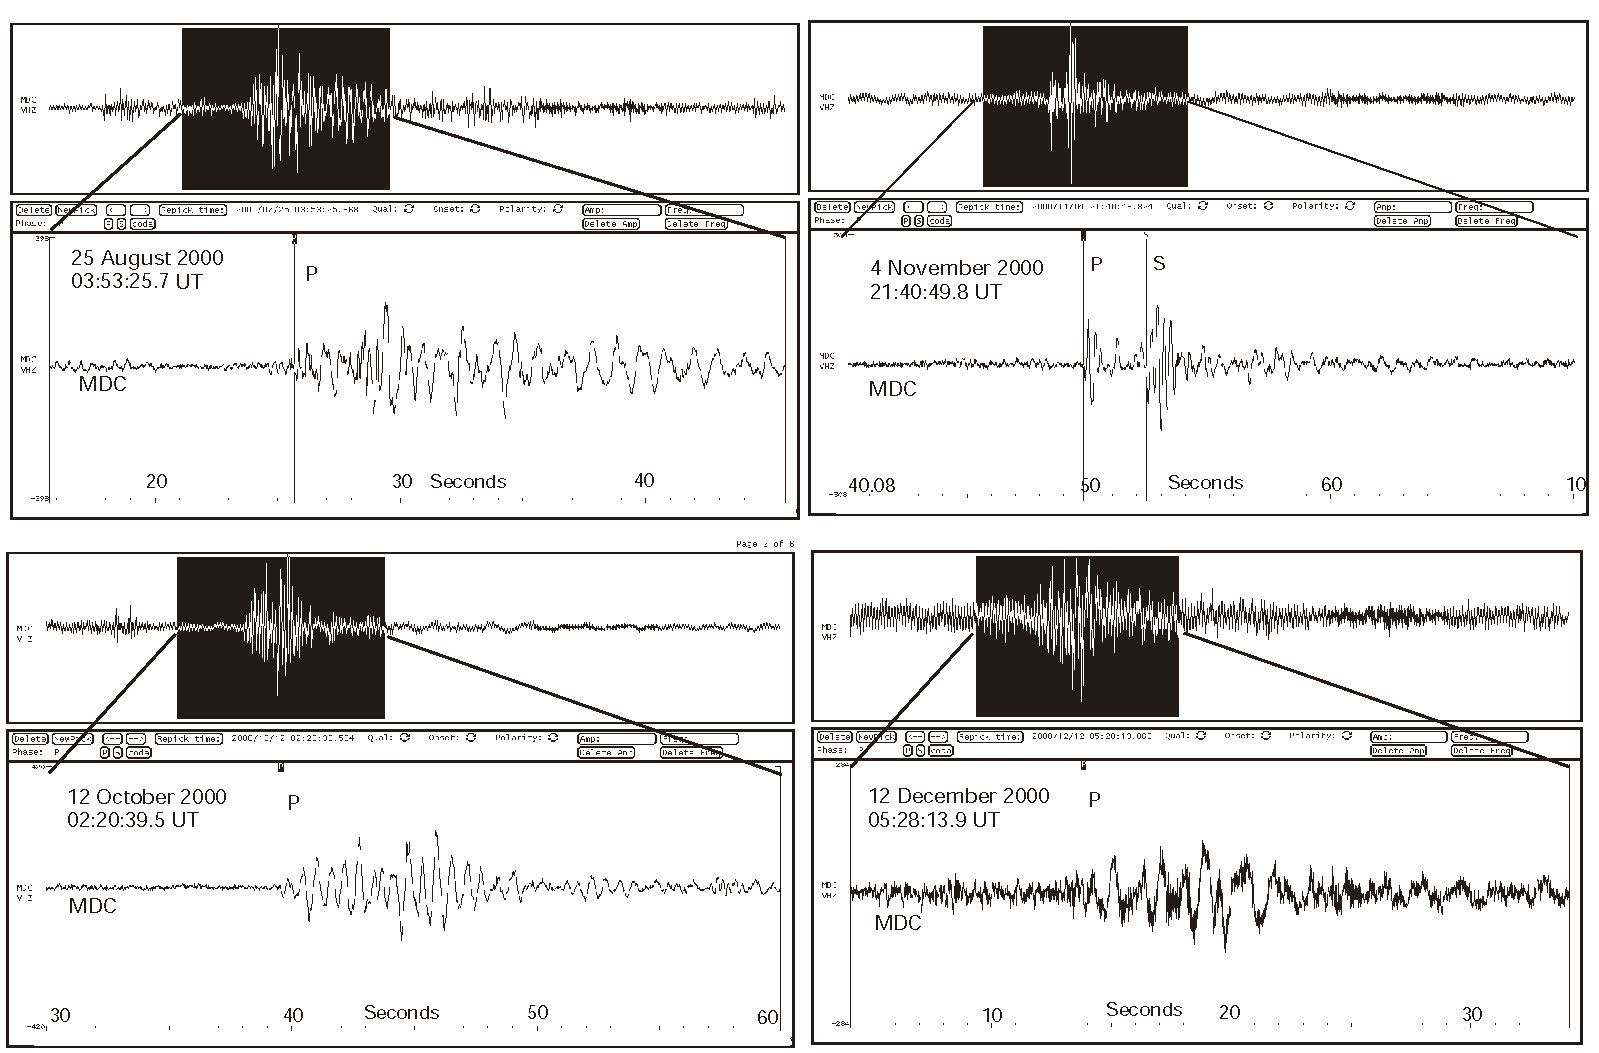
Figure C2. Seismograms of deep, long- period (LP) volcanic earthquakes beneath Mammoth as recorded on the station MDCM, which is located 10 km (6 miles) north of Mammoth Mountain (see fi g. D1). In each of the four examples, a 30- second- long section of the upper trace (black background) is shown in expanded form below with the P- and, in one case, S- wave arrivals marked by vertical lines. The time indicated for each event is the P- wave arrival time in hr: min: sec (Universal Time). MDCM is a vertical component seismometer with a 1-second natural period. (Click for large version of Figure C2.)
Clear examples of VLP volcanic earthquakes have also been documented beneath a number of volcanoes (Chouet and others, 1998; Kaneshima, and others, 1996; Takeo, 1990). These VLP earthquakes have dominant spectral peaks at periods of tens of seconds and appear to be associated with the transport of slugs of fluid (magma, magmatic brine, or gas) through cracks or dikes within or beneath the volcanic edifice.
To date, three VLP earthquakes have been recorded beneath Mammoth Mountain; one on October 13, 1996, and the other two on July 6 and August 13, 2000 (fig. C3). These events were detected in the seismic band (0.1 to 400 sec) of the POPA borehole dilatometer, which is located 4 km (2.5 miles) due west of the summit of Mammoth Mountain. Each developed as a single-sided, dilatational strain transient over periods of 30 to 120 sec with peak strain amplitudes of ~ 1 nanostrain. The first two showed small (~0.2 nanostrain) compressional offsets. Each was accompanied by spasmodic bursts of HF earthquakes and LP earthquakes. Based on hypocentral locations for the associated impulsive events occurred at depth of roughly 4 km beneath the surface of Mammoth Mountain. Spasmodic bursts were common during the 1989 Mammoth Mountain earthquake swarm, and the coincidence of spasmodic bursts with these VLP earthquakes opens the possibility that VLP activity was an integral part of the 1989 activity, but no instruments were in place to record the 100-1 sec band at the time. These Mammoth Mountain VLP earthquakes are similar to VLP earthquakes recorded beneath the summit of Kilauea Volcano, Hawaii, which Ohiminato and others (1998) interpret as being generated by the transport of a slug of magma or gas through a crack.
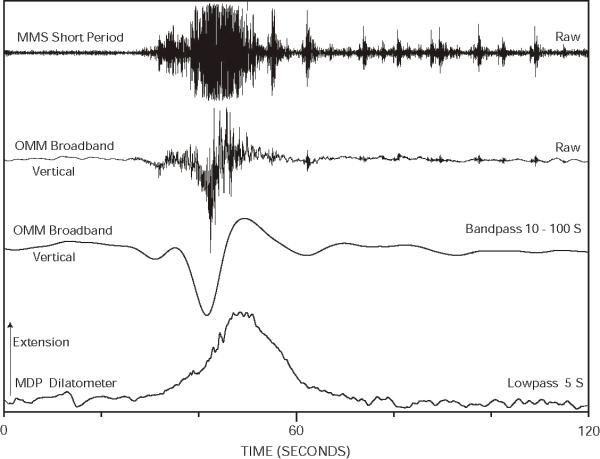
Figure C3. Seismograms of the August 13, 2000, very-long-period (VLP) earthquakes beneath Mammoth Mountain. Top is unfi ltered trace from the short-period (1 second, vertical seismometer) Northern California Seismic Network (NCSN) station (MMSM) on top of Mammoth Mountain (note the spasmodic burst). Middle two traces are unfi ltered and filtered (10 to 100 second bandpass) vertical component records, respectively, from the CMG-3 broadband station (OMM) installed in a shaft of the Old Mammoth Mine (4 km (2.5 miles) southeast of Mammoth Mountain) and operated by the University of Nevada, Reno. Bottom is a low-pass (5-second cutoff) trace from the POP borehole dilatometer located 4 km (2.5 miles) due west of the Mammoth Mountain summit (see fig. D1 for station locations).
Harmonic tremor is a nearly monochromatic sequence of seismic waves with dominant frequencies typically ranging from 1 to 5 Hz that may persist with relatively steady to strongly fluctuating amplitude levels for minutes to hours (fig. C4). Harmonic tremor accompanies nearly all volcanic eruptions and commonly precedes the onset of eruptive activity by hours to days. In some cases, harmonic tremor evolves from a sequence of overlapping LP earthquakes pointing to a common source process. A few isolated sequences of what may be harmonic tremor were recorded during the 1997-98 earthquake swarm activity in Long Valley Caldera (fig. C5).
Figure C4. Example of seismogram showing weak harmonic tremor along with long-period (LP) and high-frequency (HF) earthquakes recorded on Nevada del Ruiz Volcano, Colombia, on September 9, 1985 (modifi ed from Chouet, 1991).
 |
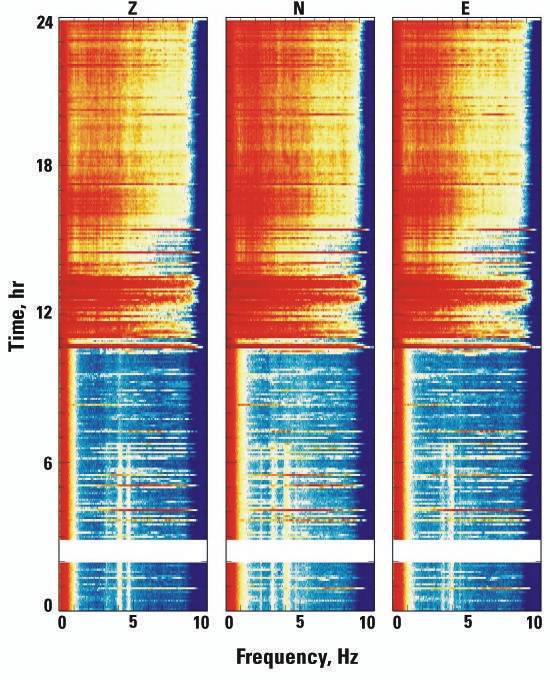 |
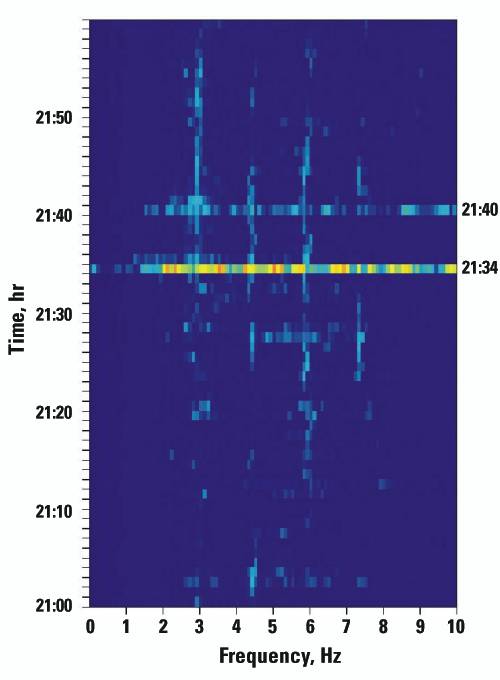
| Figure C5. Examples of spectrograms illustrating the distinctive signatures of high-frequency (HF) (volcano tectonic) earthquakes and harmonic tremor in the time-frequency domain. The abrupt, broadband nature of HF earthquakes produces horizontal bands spanning all frequencies while the comb-like spectrum and extended duration of harmonic tremor results in multiple vertical lines in the spectrogram. In combination, these two seismic sources produce spectrograms with a madras-like pattern. Warmer colors represent higher spectral amplitudes on these plots. A, Spectrogram for a 1-hour (21:00-22:00 Universal Time (UT)) period on July 30, 1998, from station MEMM in Long Valley Caldera (see fig. D1). This is a vertical-component, short-period (1 Hz) station. The distinct horizontal bands at 21:34 and 21:40 UT are HF earthquakes (a magnitude (M)=2.9 earthquake located 8 km (5 miles) south of MEMM and a M = 2.6 earthquake located 15 km (9 miles) southeast of MEMM, respectively). The weak, vertical bands at frequencies of ~2.9, 4.5, 5.8, and 7.2 Hz are spectral peaks of a tremor-like signal. The source of this signal is unknown, except that its amplitude is strongest on station MEMM, and the source is presumably somewhere in the vicinity of the station on the resurgent dome in the caldera. B, Spectrograms for a 24-hour period for day 273 (September 30), 1996, from the three-component station HOT23 on Vatna Jökull Glacier, which covers Grimsvötn Volcano in Iceland. The first 6 hours show multiple, horizontal, broadband streaks associated with an earthquake swarm together with vertical spectral bands of harmonic tremor (with several pronounced spectral peaks between 3 and 5 Hz). Both the tremor and swarm activity decline some 4 hours prior to the onset of a volcanic eruption beneath the glacier at about 11:00 hours (UT) marked by the onset of the pronounced, nearly continuous red pattern spanning most of the spectrogram. Although the tremor is clear on in the early part of this spectrogram, it was essentially lost in the coda of the swarm earthquakes and not recognized in the seismograms prior to the eruption (Gudmundsson and others, 1997). | |
Earthquakes intermediate in character between (HF) earthquakes at one extreme and narrow-band, volcanic earthquakes at the other (hybrid earthquakes) are common on active volcanoes, and they appear to result from a variety of processes. In some cases, for example, HF earthquakes produce seismograms with a lowfrequency appearance because the highfrequency energy generated at the source is scattered by strong heterogeneities in the crust (commonly true for extremely shallow earthquakes-depths less than 2 to 3 km or 1 to 2 miles) or attenuated by propagation through a "soft" volume such as a magma body. In other cases, the earthquake may result from an initial brittle failure event that then triggers resonance in an adjacent, fluid-filled crack. A number of isolated earthquakes in Long Valley Caldera that fall in this intermediate category have been recorded (see Cramer and McNutt, 1997).
Identification of volcanic seismic signals by their respective signatures on seismograms can be difficult when background activity levels are elevated (due say to weather-generated noise or an intense swarm of high-frequency earthquakes). Real-time spectrograms provide an invaluable aid in this regard. Spectrograms display spectral amplitudes as a function of time using a color scheme to represent the relative amplitude of a given spectral component (usually with warmer colors indicating higher amplitudes). Spectrograms are commonly plotted with increasing time on the vertical axis and frequency on the horizontal axis (see fig. C5). On such a display, high-frequency earthquakes appear as horizontal streaks of warm colors that span most of the spectral band with each streak corresponding to the time of an individual earthquake. Harmonic tremor, in contrast, appears as a series of vertical streaks over an extend time interval with each streak representing a spectral peak constituting the tremor signal. LP earthquakes also appear as vertical streaks but with limited vertical (temporal) extent. Hybrid earthquakes typically appear as a series of short vertical streaks extending above a horizontal streak, the latter representing the relatively abrupt, broadband onset of Hybrid events. The result is a madras-like pattern as illustrated by the examples in figure C5, the basic aspects of which can often be recognized through an irregular "warming" of the spectrogram due to elevated background noise.
High-Frequency Earthquakes
The seismic criteria in the condition codes (table 2) involving high-frequency (HF) earthquake activity are expressed in terms of a threshold magnitude (for example, one or more M> or =4 earthquakes per day) or a daily activity rate for smaller earthquakes (for example, >5 M> or =3 earthquakes/day). These seismic criteria apply to earthquake swarm activity within the confines of the caldera, along the Mono-Inyo volcanic chain, and beneath Mammoth Mountain. They will not normally apply to seismic activity in adjacent areas such as Sierra Nevada block south of the Long Valley Caldera, the upper Owens Valley, or the Chalfant Valley that, based on the geologic record, are unlikely sites for the onset of volcanic activity in the near future.
Particular choices of magnitude and rate thresholds for the four activity levels within condition GREEN and for the transition from GREEN to YELLOW reflect the varying levels of earthquake swarm activity within the caldera since 1980. Earthquake swarm activity under "intense unrest"1 and a condition YELLOW, for example, includes one or more M> or =5 earthquakes, five or more M> or =4 earthquakes/per day, or 30 or more M> or =3 earthquakes per day. This choice of these parameters for condition YELLOW, which requires a commitment of personnel and resources in an EVENT RESPONSE (table 2), is based on the following considerations:
1Note:
Usage here and in tables 1 and 2 of weak, minor, moderate-to-strong, and intense
applied to increasing levels of volcanic unrest should not be confused with
the qualitative terminology used for individual earthquakes (for example, minor
for M=3.0 to 3.9, light for M=4.0 to 4.9, moderate for M=5.0 to 5.9, strong
for M=6.0 to 6.9, major for M=7.0 to 7.9, and great for M>8.0). This distinction
is based on the recognition that (1) intense unrest, which includes an earthquake
swarm with at least one M> or =5 (moderate) earthquake, is near the
upper limit for seismic swarm activity in most volcanic areas, (2) a swarm of
this intensity typically includes frequent, locally felt earthquakes (magnitudes
in the M=3 to M=4 range) giving the subjective impression of “intense”
earthquake activity to anyone who happens to be in the vicinity, and (3) deformation
accompanying volcanic unrest is typically many times that associated with an
individual earthquake with a magnitude matching the largest earthquake
in a volcanic swarm sequence.
Activity rates for smaller earthquakes governing the criteria for transition from one activity level to another are based on the Benioff strain equivalent to the corresponding threshold magnitude (Benioff, 1951). Benioff strain is proportional to the square root of radiated seismic energy and thus to the square root of seismic moment, which in turn is proportional to the radiated energy (Hanks and Kanamori, 1979). Thus the Benioff strain equivalent of a M=5 earthquake is approximately 5 M=4 earthquakes and 30 M=3 earthquakes while the energy (or moment) equivalent is approximately 30 M=4 earthquakes and 900 M=3 earthquakes. For the purposes of this document, a strain criteria is more useful than one based on seismic moment (or radiated energy) because (1) a strain-based criteria gives greater importance to smaller earthquakes than does a criteria based on radiated energy or seismic moment, and (2) strains and strain rates associated with magmatic intrusions more relevant than the cumulative slip along a single fault.
Volcanic Earthquakes
Because volcanic earthquakes (LP earthquakes, VLP earthquakes, and harmonic tremor) are a robust seismic indicator of actively intruding magma, an escalation of their occurrence in the upper 5 km of the crust beneath Long Valley Caldera, Mammoth Mountain, or the Mono-Inyo volcanic chain will play a progressively more important role in the transition criteria to conditions YELLOW and ORANGE, respectively (table 2). As with other precursory activity, however, volcanic earthquakes do not inevitably culminate in an eruption; nor does the absence of precursory volcanic earthquakes preclude an eruption. For example, the intense earthquake swarm that began 27 hours prior to the onset of the September 1994 eruptions in Rabaul Caldera did not include readily identifiable LP earthquake activity or harmonic tremor.
At current levels, the deep LP earthquakes (focal depths between 10 to 25 km) beneath Devils Postpile and the southwest flank of Mammoth Mountain (fig. A5), the three VLP earthquakes beneath the summit of Mammoth Mountain, and the occasional deep LP earthquakes just to the west of the Mono Craters qualify as background activity. Although these volcanic earthquakes indicate that magmatic processes are currently active, they do not portend an imminent volcanic eruption, at least at the activity rates documented since the onset of this activity in 1989 (Pitt and Hill, 1994), which ranged from several per month to a peak of 15 to 20 events per week during November and December, 1997. Midcrustal LP earthquake activity at these levels seems to be a relatively common, long-term phenomenon beneath many young volcanic systems (Hasegawa and others, 1991). The same applies to the occasional events with the appearance of shallow LP earthquakes and harmonic tremor recorded within Long Valley Caldera (Cramer and McNutt, 1997; Hough and others, 2000).
Ground deformation precedes nearly all volcanic eruptions in response to increasing pressures within shallow crustal magma chambers or subsurface displacements produced by the upward intrusion of magma into the shallow crust. The deformation may be minimal for volcanoes that erupt frequently from a well-established conduit system. In most welldocumented cases of eruptions from volcanic systems that have been in repose for several decades or more, however, precursory ground deformation is pronounced. Documented surface displacements in the hours to days prior to volcanic eruptions in such systems commonly range from tens of cm to several m, and the associated strains and tilts may range from tens to several hundred ppm. [Note: In this document parts per million (ppm) is used to include both strain and tilt expressed as microstrain (1x10⁻⁶) and microradians (1x10⁻⁶ radians), respectively.]
Table C1 summarizes the deformation rate criteria used in the condition codes of table 2. These criteria are based on order-of-magnitude (factor of ten) differences in deformation rates in order to reflect both 1) the broad range of deformation rates observed before eruptions and (2) the fuzzy nature of these criteria. In particular, the single significant figures used in these order-of-magnitude criteria should be regarded as uncertain by at least a factor of two. A "~" followed by a single significant figure emphasizes the approximate nature of these values. Thus, for the purposes of this document, 20 cm/yr (8 inches/yr) is approximately equivalent to a 0.5 mm/day rate sustained for one year.
|
Condition Code
|
Strain and/or tilt rates1
|
Displacement rates2
|
||||
|
24-hr (ppm/d)
|
weekly (ppm/w)
|
annual (ppm/y)
|
24-hr (mm/d)
|
weekly (mm/w)
|
annual (mm/y)
|
|
|
GREEN |
<0.01 | <0.1 | <5 | NA** | NA | <5 |
| Minor Unrest | >0.01 | >0.1 | >5 | NA | NA | >5 |
| Moderate-to-strong unrest | >0.1 | >1 | >50 | NA | >5 | >20 |
| YELLOW | >1 | >10 | >500 | >5 | >50 | >2,000 |
| ORANGE | >10 | >100 | >5,000 | >50 | >500 | >20,000 |
1 Strain and tilt rates
based on corresponding displacement rates over a 5-km baseline.
2 Displacements below 1 mm and not resolvable by the 2-color EDM and GPS systems.
Table notes:
As with other precursory phenomena, however, episodes of pronounced ground deformation do not inevitably culminate in a eruption, at least in the short term. The 1-ppm/day or 1-mm/day thresholds for condition YELLOW, for example, are based in part on recognition that large, restless calderas can sustain deformation rates of several mm per day for extended periods (months to a year or more) without necessarily culminating in a volcanic eruption. Uplift rates of 2 to 3 mm/day (0.08 to 0.12 inch/day) sustained for over 12 months at both Campi Flegrei Caldera, Italy (Dvorak and Gasparini, 1991), and Rabaul Caldera, Paupa New Guinea (Blong and McKee, 1995), in 1983-84, for example, were followed in each case by a decade or more of relative quiescence. Rabaul Caldera, however, began erupting in September of 1994 following 27 hours of intense precursory unrest that include a swarm with two M=5 earthquakes and uplift of more than 6 m (20 feet) in the vicinity eruptive vents. Deformation precursory to the 1989 and 1997 dike intrusions off the Izu Peninsula, Japan, included tilts more than 5 microradian (ppm) per day (Aoki and others, 1999; Okada and Yamamoto, 1991). Both of these weeklong intrusive episodes were accompanied by strong earthquake swarms, each including a M=5 earthquake. The 1989 episode culminated in a small basaltic eruption (Okada and Yamamoto, 1991); the 1997 episode did not culminate in an eruption. These examples from the Izu Peninsula emphasize the challenge in determining whether a magmatic intrusion in progress has sufficient energy to breach the surface.
The theoretical deformation profiles (fig. C6) calculated for an intruding dike show that the initial strain and displacement changes for the onset of intrusion of a 1-meter-thick (1-yard-thick) dike at a depth of 10 km (6 miles) will begin to exceed these threshold amplitudes (the actual strain rates, of course, will depend on the dike intrusion rate). Likewise, a 10-cm-thick (4 inch thick) dike will begin to exceed these changes when its top reaches a depth of about 5 km (3 miles). Both the January 1983 swarm beneath the SMSZ and the 1989 Mammoth Mountain swarms appear to have involved the intrusion of thin dikes (thicknesses <10 cm) to within 3 km (1.8 miles) of the surface (Hill, and others, 1990; Langbein, and others, 1993; Savage and Cockerham, 1984). As is evident from the two-dimensional plots in figure C6, the amplitude and sense of strain, tilt, and deformation about a specified intrusion (in this case a dike) show considerable spatial variation (the variation is even greater in a full, three-dimensional plot). This can be either an advantage or disadvantage, depending on the location of the intrusion with respect to the array of deformation-monitoring instrumentation and the density of instrument sites within the array. In particular:
Figure C6. Theoretical deformation profi les for an intruding dike in an elastic half space. The profiles are perpendicular to the long axis of a north-striking dike. They extend 20 km (12 miles) to the east from a point on the surface directly above the mid-point of the dike. The dike is 5 km (3 miles) long (N-S) and 3 km (1.8 miles) high with a width of 1 meter (1 yard). The profiles show deformation at the surface when the dike is centered at depths of 10, 8, 6, and 4 km (the top of the dike extends to within 2.5 km (1.5 miles) of the surface in the latter case). Note that for a fixed dike length and height, the amplitudes of the surface deformations scale directly with dike width. Thus, the deformation amplitudes for a 10-cm-thick (4 inch thick) dike will be one tenth of those for the 1-meter-thick (3 foot thick) dike.
The threshold for the transition to condition ORANGE is set at the relatively high strain rate of 10 ppm/day (corresponding displacement rates on the order of 10 cm/day or 4 inches/day) for the Long Valley Caldera-Mono Craters region. Although a real-time deformation monitoring network was not in operation in Rabaul Caldera at the time of the September 1994 eruption, scientists at the Rabaul Observatory describe a 6-m uplift that had developed overnight prior to the onset of eruptive activity at 6:06 AM (local time) on September 19 (Blong and McKee, 1995). Chronicles of the 1538 eruption in Campi Flegrei Caldera, Italy, describe a remarkably similar ground uplift of 6 to 9 m (20 to 30 ft) that developed overnight in the vicinity of the vent that erupted to produce Monte Nuovo cone in the center of the caldera (Dvorak and Gasparini, 1991; Rosi and Santacroce, 1984). The strain and displacement rates associated with such pronounced uplifts far exceed those specified above for condition ORANGE and would easily be detected by the real-time, deformation-monitoring network in Long Valley Caldera.
These criteria require that elevated deformation or strain rates be detected on multiple instruments or baselines to guard against being misled by spurious strain or deformation signals (instrument malfunction or disturbances local to a particular monument or instrument site, such as surficial slumping, or disruptions due to animal or human activities). Any single deformation signal meeting the criteria listed in table C1 in the absence of one or more of the additional precursors should raise suspicions that the source of the deformation may be a nonmagmatic intrusion. In this unlikely situation, it would be especially important to confirm that suspicious deformation signals were not due to meteorological processes associated with a strong storm system or perhaps local flooding. Obviously, the unlikely coincidence of a magmatic intrusion and a strong storm or flooding would present special challenges to all concerned.
As with the other precursory parameters (seismicity and deformation), it is not possible to realistically anticipate all significant variations in the patterns of gas emissions and geochemical activity that might precede an eruption in Long Valley Caldera or along the Inyo-Mono Craters chain. The significance of the measurements of CO2 concentration and soil CO2 flux during periods of increasing unrest remains uncertain because of limited experience to date with these newly developed monitoring tools. Also, it is necessary to be prepared to incorporate less commonly used geochemical indicators in many decisions involving the transition from one condition to the next. For example, scientists monitoring the unrest may become aware of widespread reports of intense "rotten-egg" odors (H2S) and/or energetic steam venting and blasting (but not involving the ejection of rock fragments). Either or both of these may result from the boil-off of hydrothermal fluids by a shallow intrusion and either would provide strong support for making the transition from condition GREEN to YELLOW. Such activity would probably be coupled with greatly elevated CO2-emission rates and minimal SO2-emission rates. The latter tends to be scrubbed (absorbed in solution) by hydrothermal waters thus masking its presence as a magmatic gas. The onset of elevated SO2-emission rates would suggest that the hydrothermal system had completely boiled away and would provide support for making the transition from conditions YELLOW (or GREEN) to ORANGE.
Just as for seismicity rates, magnitudes, and strain rates specified in table 2, the CO2- and SO2-flux rates specified for the transition between color conditions are approximate only. Initial estimates for gas emission rates may be uncertain by 20 to 30 percent because of normal wind variability. Soil-gas concentrations and fluxes can be severely influenced by weather and seasonal factors.
Intruding magma may be accompanied by a host of other phenomena, such as changes in the level and temperature of ground water, magnetic properties of rock, electrical conductivity, induced electro-magnetic signals, fumarole activity, and ground cracking. The transition criteria do not explicitly include these phenomena, which in many cases involve monitoring techniques that are still in the research/experimental stage. Confirmed recognition of such phenomena, however, may help decide the transition to condition YELLOW or ORANGE in otherwise marginal situations. The most important of these additional precursory indicators include:
Coherent changes in several of these parameters will carry more weight than a pronounced change in a single parameter.
URL: https://pubs.usgs.gov/bul/b2185/appenda.html
Maintained by: Michael Diggles
Last modified: May 18, 2005