![]()
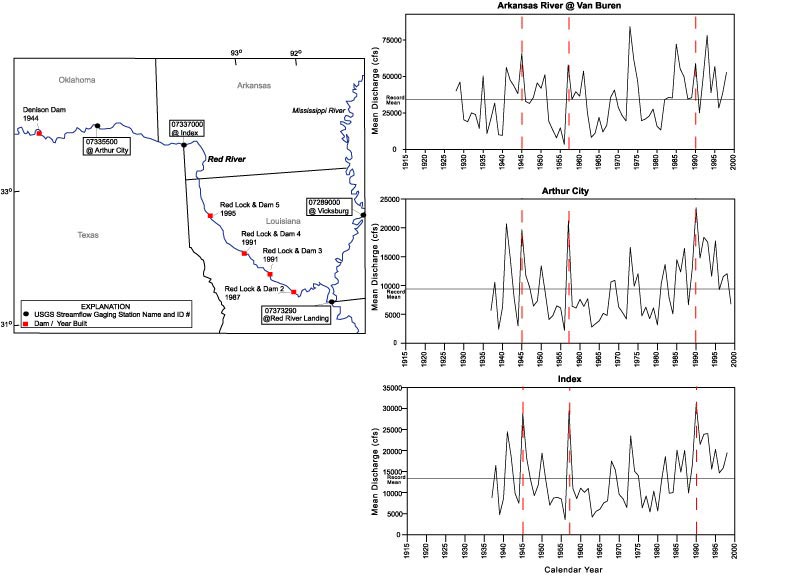
Figure 9. Red River gaging station locations and discharge records. Comparisons of selected gaging station records indicate that mean annual discharge has not been significantly modified by manmade structures. The discharge record for the Arkansas River is repeated from figure 8 for comparison; it shows that the records of the Arkansas River and Red River are similar. Dashed vertical lines track similarities between the records; the horizontal line in each record represents the mean discharge for the entire record. cfs, cubic feet per second.
U.S. Geological Survey, U.S. Department of the Interior
This page is https://pubs.usgs.gov/bulletin/b2187/figure9.html
Contact: Harry Dowsett (hdowsett@usgs.gov)
Last modified 09.07.01 (krw)
This page is https://pubs.usgs.gov/bulletin/b2187/figure9.html
Contact: Harry Dowsett (hdowsett@usgs.gov)
Last modified 09.07.01 (krw)