Data Series 932
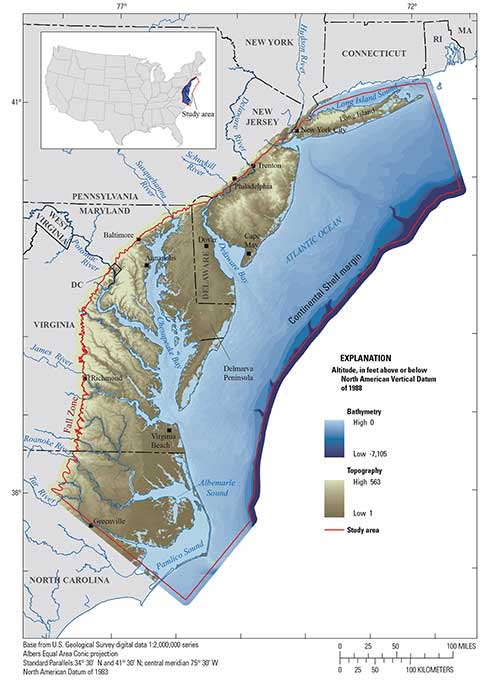
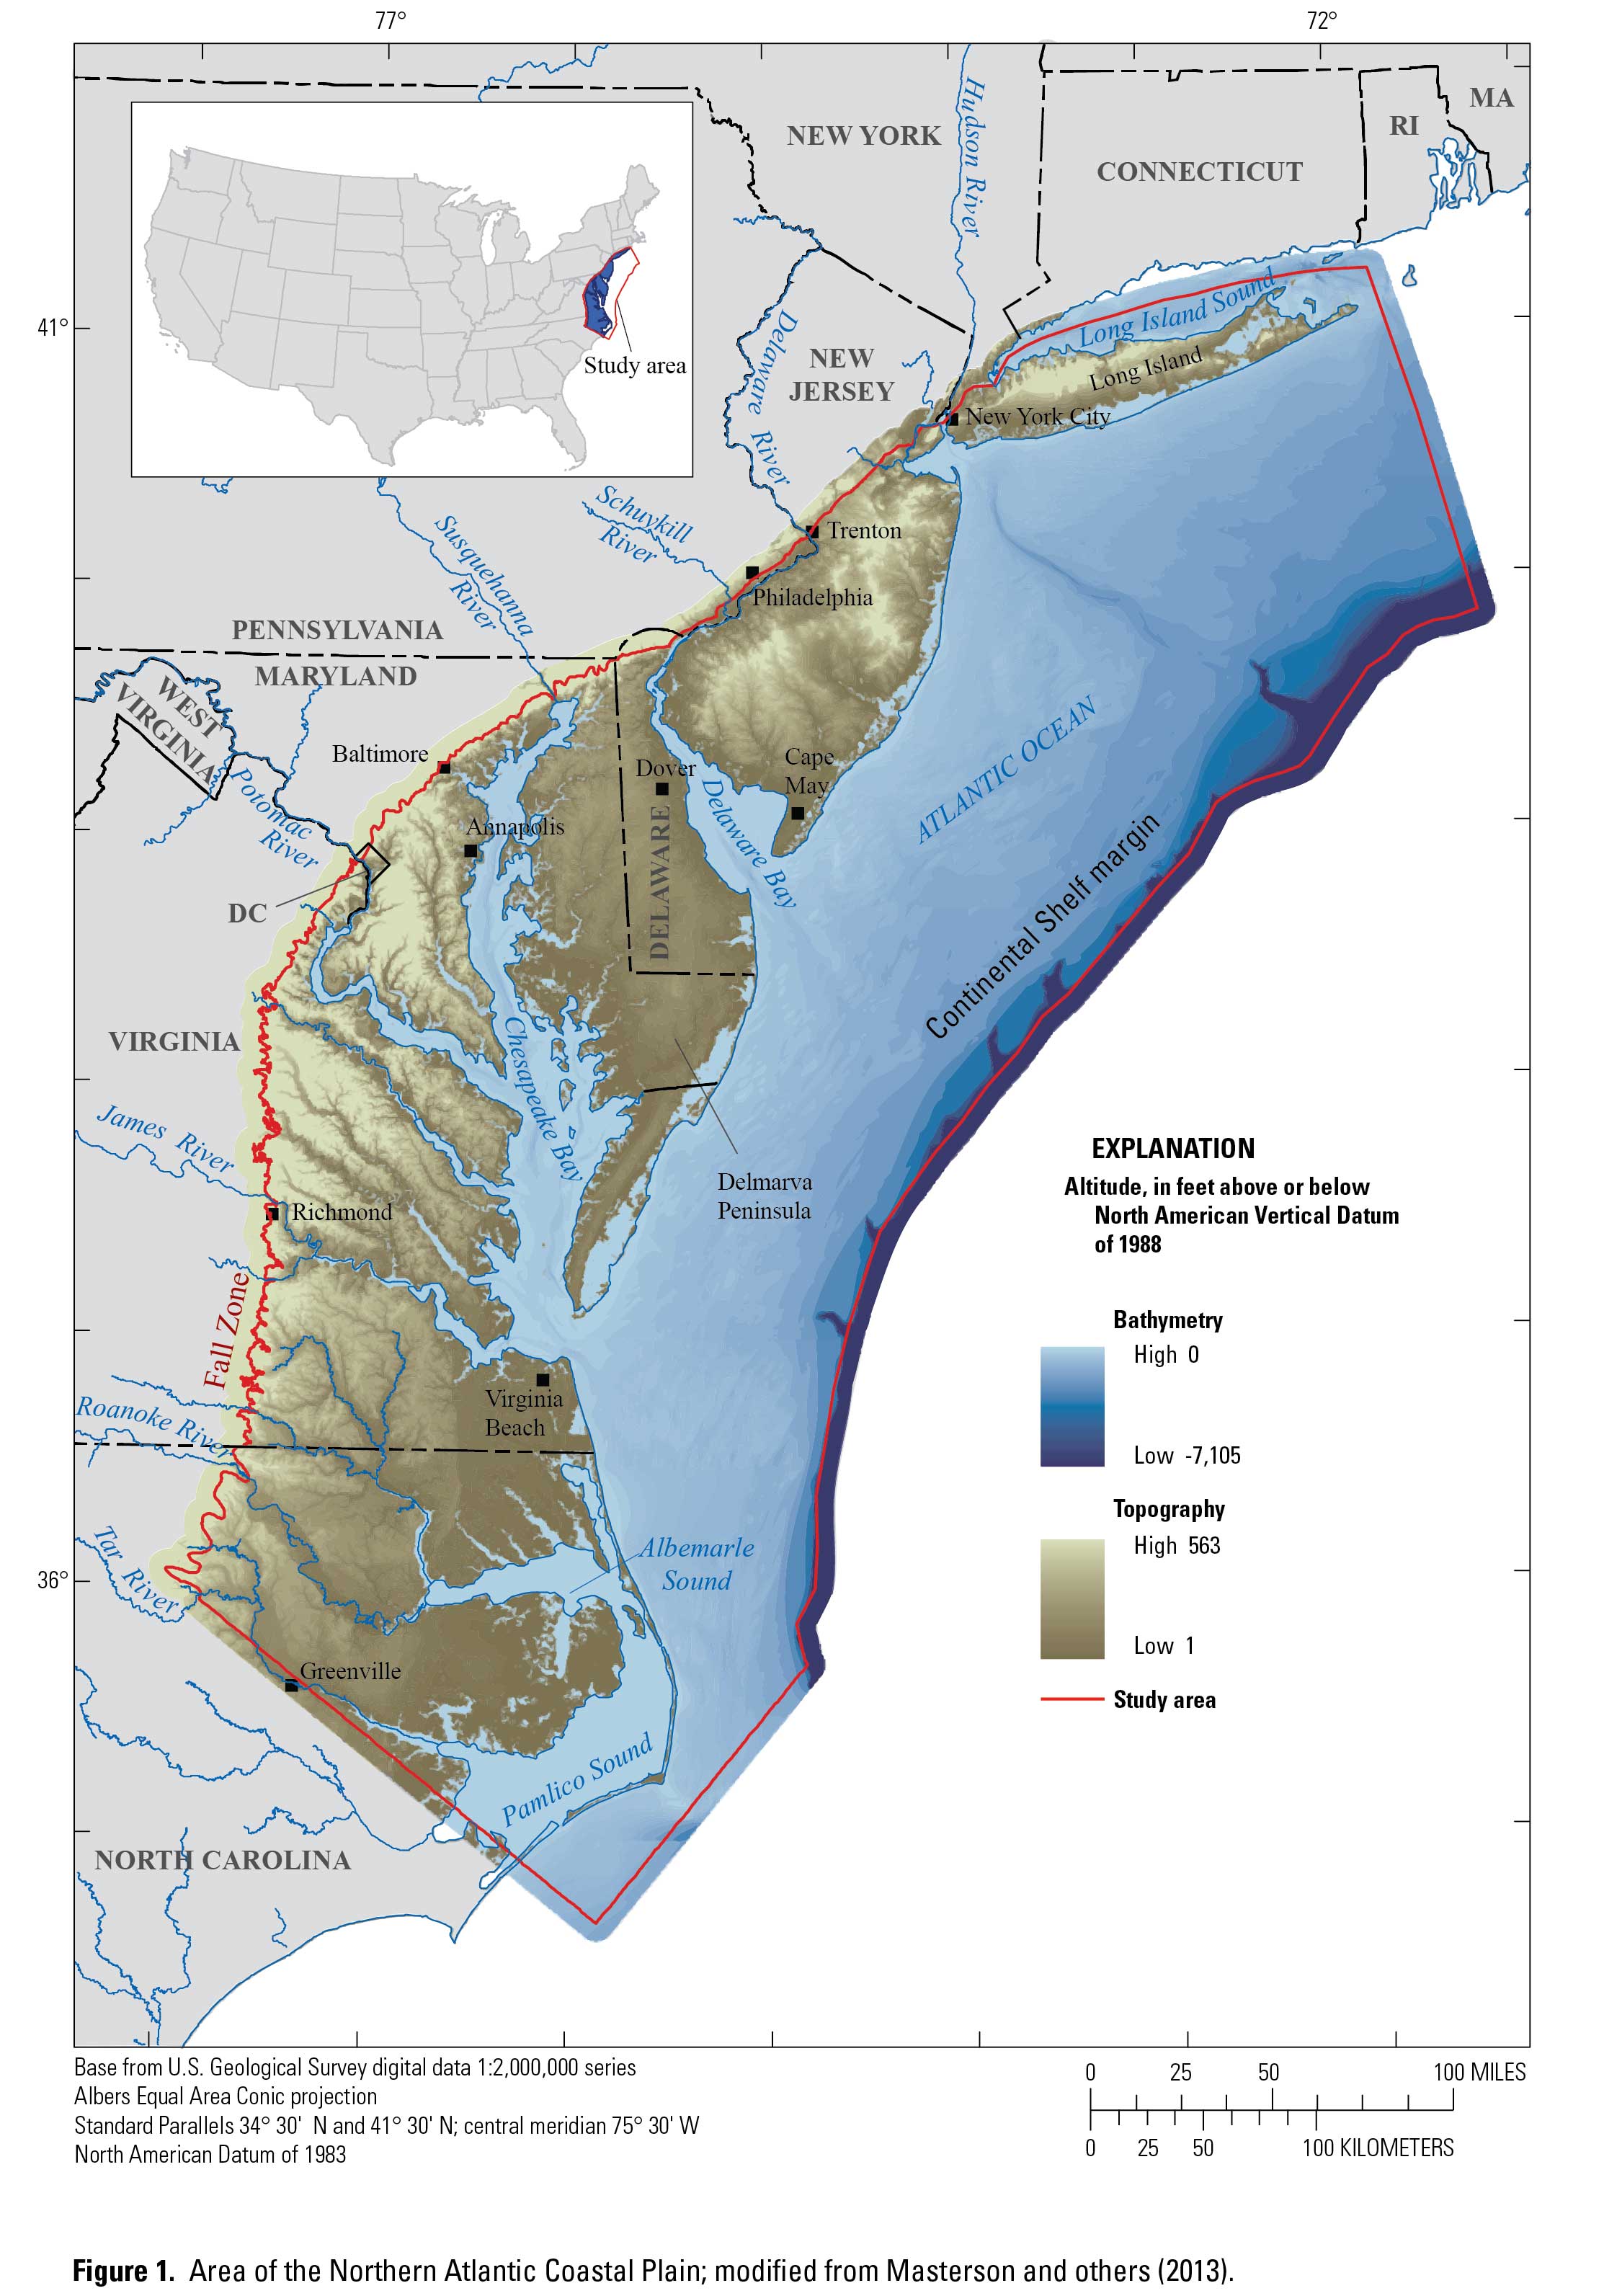
IntroductionThe Northern Atlantic Coastal Plain (NACP) extends along the eastern seaboard of the United States (fig. 1) and is a seaward-dipping sedimentary wedge running from eastern North Carolina to Long Island, New York. On average, the area receives about 45 inches per year (in/yr) of rain, but surface freshwater is limited because many of the coastal surface waters in the area are brackish (Masterson and others, 2013). Kenny and others (2009) showed irrigation withdrawals to be a large part of water use throughout the NACP. Farmers in this area depend on irrigation to help produce crops of consistent quality and quantity in addition to providing a hedge against extended dry periods during critical stages of crop development. As of late, irrigation practices and associated water use have been expanding rapidly with the consolidation of farm operations and changing commodities prices. In some counties, irrigation withdrawals constitute the highest water use, such as in Queen Anne’s County, Maryland, where irrigation accounts for nearly 66 percent of all water use (Kenny and others, 2009). The spatial distribution of irrigation water use is a critical data component needed for the simulation of groundwater flow of the NACP. Existing sources of water-use data, such as county level irrigation withdrawal estimates are available through the U.S. Geological Survey (USGS) National Water-Use Information Program (U.S. Geological Survey, 2014c), but these water-use data tend to be reported on a scale too coarse to meet the spatial requirements for simulation of groundwater flow. The dataset was developed to enhance the understanding of irrigation water demands and associated groundwater withdrawals. The USGS plans to use this dataset in a regional groundwater-flow model to evaluate water availability within the NACP (Masterson and others, 2013; U.S. Geological Survey, 2014a,b). This work was a cooperative effort between the USGS and the University of Delaware Agricultural Extension and was focused on identifying center-pivot irrigation systems. Data Sources for Delineating Irrigated AcresThe dataset was created to fill a requirement of the NACP groundwater-flow model for spatially and temporally accurate withdrawal data. Aerial imagery used in this mapping work was from a variety of sources and time periods (table 1). Most of the mapping for Delaware was done by the University of Delaware Cooperative Extension using the Google Maps mapping service and imagery from 2010 (James Adkins, University of Delaware Agricultural Extension, written commun., 2013). Accurate identification and delineation of irrigation systems was a manual process and was subject to occasional omissions and misinterpretations. Delineation and Geospatial CompilationThe spatial representation of the irrigation withdrawals was satisfied by an estimation approach using a soil-water balance model (Westenbroek and others, 2010) along with irrigation areas spatial data. The soil-water balance (SWB) model published by the U.S. Geological Survey (Westenbroek and others, 2010) calculates irrigation demand on a cell-by-cell basis by applying daily meteorological data with irrigated crop areas data and user-supplied crop water demand coefficients to estimate crop water demand. The SWB model assigns crop water demand not filled by precipitation or soil moisture as irrigation demand. This irrigation demand is simulated in the groundwater-flow model as withdrawals. Polygons representing the center-pivot irrigation areas were captured in a computer system using Esri ArcMap geographic information system (GIS) software and heads-up digitizing methods by visual inspection of center-pivot irrigation areas as seen on aerial imagery from 2010 to 2012 (U.S. Department of Agriculture, Farm Service Agency, 2014). Maps from Microsoft Bing Maps and the Google Maps mapping service from 2013 were used to supplement the USDA imagery. An exception is those polygons digitized by the University of Delaware, where imagery from the Google Maps mapping service from 2010 was used (James Adkins, University of Delaware Agricultural Extension, written commun., 2013).
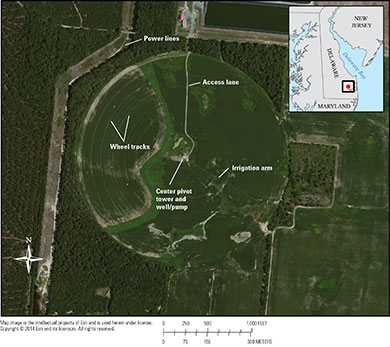
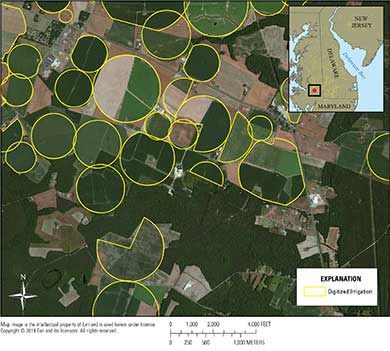
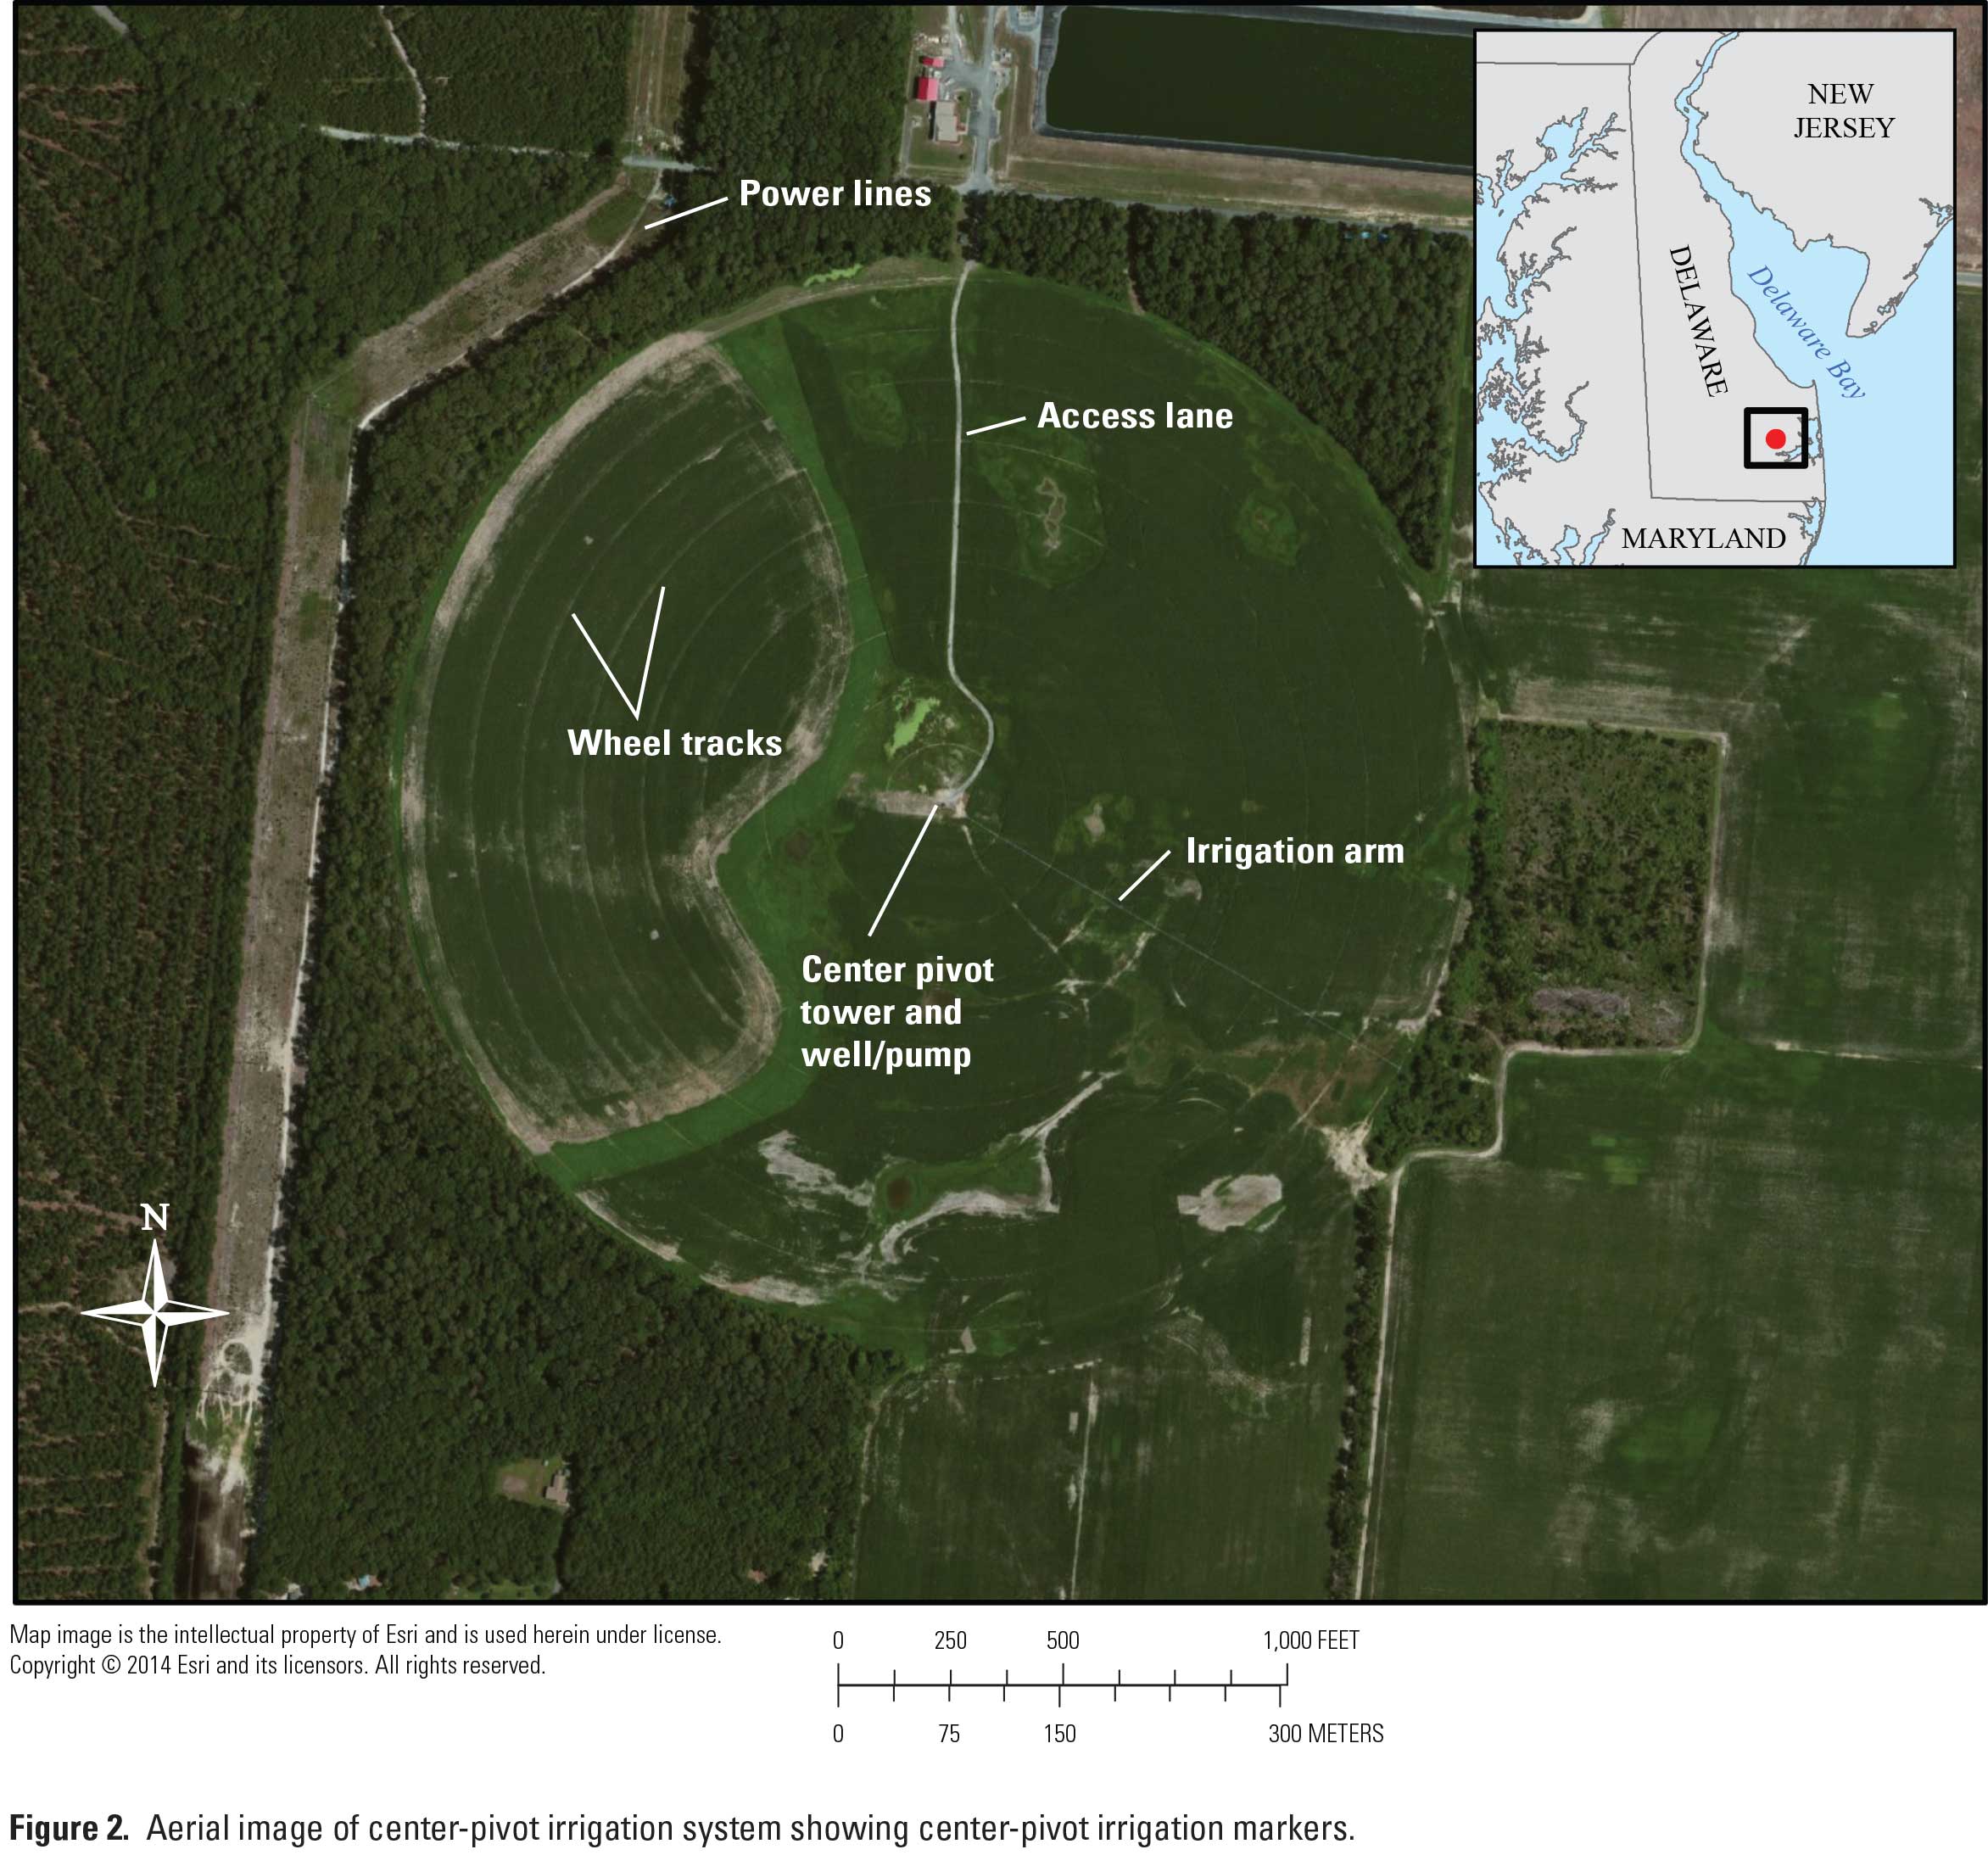
Operators organized county images into grid cells to subset areas and track the lands that had been processed. Signs of irrigation systems (fig. 2), such as wheel tracks, piping, pumps, crop planting patterns (crop circles), and crop color, were identified and digitized by outlining the area of the crop from the imagery and representing the final product as a polygon feature. Polygons were categorized by confidence level of the digitizer. A high confidence level indicates that the imagery clearly shows multiple signs of center-pivot irrigation. Low-confidence-level polygons are most likely still irrigated areas, but the imagery did not display the multiple signs that characterized polygons of high confidence. Other types of irrigation systems, such as drip and flood, are not included within this dataset. It is worth noting that, in some instances, rectangular fields that contained irrigation systems were observed. Even though these systems are not center-pivot systems, the areas they were on were still identified as irrigatedlands and digitized to represent irrigation areas in the dataset. Delineating features as polygons allowed acreage calculations for direct comparison with U.S. Department of Agriculture (USDA) farm and ranch irrigation survey (FRIS) data (U.S. Department of Agriculture, National Agricultural Statistics Service, 2014). In cases where irrigated areas overlapped, overlapping systems would in fact double irrigate because systems are not typically zoned so that areas under a given system can be turned on and off. When systems are run, they typically irrigate across the entire system coverage area. Overlapping polygons were counted separately and not dissolved into one polygon. Digital MapDigitized Acreage Throughout the NACPThe digital irrigation coverage consists of 5,438 polygons throughout the NACP study area, which sum to 271,938 acres. In some areas of the study, irrigation can be quite dense as shown in figure 3, which shows a section of Dorchester County, Md. Dorchester County is on the Delmarva Peninsula and contains a little more than 10 percent of the total irrigation that is found on the peninsula. The pattern of crop irrigation on the Delmarva tends to follow that of soils; wetter heavier soils tend not to be irrigated and coarser grained lighter soils are irrigated. The irrigation coverage is accompanied by a metadata file, which gives more detailed information pertaining to the data. Comparing Digitized Acreage With Census of Agriculture AcreageAs reported by the Census of Agriculture (U.S. Department of Agriculture, National Agricultural Statistics Service, 2014), most irrigation for the NACP takes place on the Delmarva Peninsula. About 75 percent (206,557 acres) of the digitized irrigation is located there. The FRIS reported irrigated acreage (which included center-pivot and non-center-pivot methods) as 235,614 acres during the 2012 census of agriculture and 203,905 acres during the 2007 census of agriculture for the Delmarva Peninsula counties (portion of Dorchester County, Md., shown in fig. 3). The dynamic nature of irrigation is seen through the addition of acres and systems during 2007 to 2012. For instance, in Sussex County, Delaware, irrigation increased by about 18,000 acres from 2007 to 2012. Acres irrigated with center-pivot methods delineated by this analysis and irrigated acreage (including center-pivot and non-center-pivot methods) estimated with the 2007 and 2012 FRIS are compared in table 2. The overall digitized results underestimated the amount of irrigated acres when compared with the USDA census of agriculture, which reported 410,012 acres within the NACP extent for 2012. The digitized results of this study showed 271,938 acres. One reason these acres are not being captured in the digitized dataset is that subsurface drip and flood irrigation systems cannot be identified through aerial imagery. When comparing digitized acreage results with the 2012 FRIS data, the digitized results align most closely with FRIS results in New York and had the greatest departure from FRIS results in New Jersey. New York’s irrigation was contained primarily in Suffolk County and was within 6,528 acres of the reported value. New Jersey missed the reported value by 68,898 acres largely because of subsurface drip irrigation is prevalent there, where large acreages are planted in truck crops such as tomatoes and peppers. Some of the differences between irrigated acres captured within this dataset and those reported by 2012 FRIS can also be attributed to the addition of large numbers of irrigation systems across the landscape (James Adkins, University of Delaware Agricultural Extension, written commun., 2013). SummaryThe U.S. Geological Survey, in cooperation with the University of Delaware Agricultural Extension, created an irrigation dataset that inventoried center-pivot irrigation systems throughout the Northern Atlantic Coastal Plain. The dataset was made to obtain irrigation water demands and associated groundwater withdrawal estimates for simulation of a regional groundwater flow for the study area. Comparisons against the U.S. Department of Agriculture (USDA) farm and ranch irrigation survey for 2007 and 2012 showed how the digitized irrigated lands varied with reported values from the USDA. The differences can be attributed to the subsurface drip and flood irrigation methods that were not seen through the aerial imagery. As a whole, the dataset will be used to enhance the understanding of irrigation water demands and associated groundwater withdrawals for the Northern Atlantic Coastal Plain area. References CitedKenny, J.F., Barber, N.L., Hutson, S.S., Linsey, K.S., Lovelace, J.K., and Maupin, M.A., 2009, Estimated use of water in the United States in 2005: U.S. Geological Survey Circular 1344, 52 p. [Also available at https://pubs.usgs.gov/circ/1344/.] Masterson, J.P., Pope, J.P., Monti, Jack, Jr., Nardi, M.R., Finkelstein, J.S., and McCoy, K.J., 2013, Hydrogeology and hydrologic conditions of the Northern Atlantic Coastal Plain aquifer system from Long Island, New York, to North Carolina: U.S. Geological Survey Scientific Investigations Report 2013–5133, 76 p. [Also available at https://dx.doi.org/10.3133/sir20135133.] U.S. Department of Agriculture, Farm Service Agency, 2014, Imagery programs—NAIP imagery—National Agricultural Imagery Program (NAIP): [Also available at http://www.fsa.usda.gov/FSA/apfoapp?area=home&subject=prog&topic=nai] U.S. Department of Agriculture, Farm Service Agency Web page, accessed September 8, 2014, at http://www.apfo.usda.gov/FSA/apfoapp?area=home&subject=prog&topic=nai. U.S. Department of Agriculture, National Agricultural Statistics Service, 2014, Table 10. Irrigation—2012 and 2007, chap. 2 of State data: U.S. Department of Agriculture 2012 Census of Agriculture, v. 1, part 51, p. 332–339. [Also available at http://www.agcensus.usda.gov/Publications/2012/Full_Report/Volume_1,_Chapter_2_US_State_Level/st99_2_010_010.pdf.] U.S. Geological Survey, 2014a, Groundwater availability of the Northern Atlantic Coastal Plain: U.S. Geological Survey Web page, accessed September 10, 2014, at http://ny.water.usgs.gov/projects/NACP/. U.S. Geological Survey, 2014b, USGS groundwater information pages: U.S. Geological Survey Web site, accessed August 21, 2014, at http://water.usgs.gov/ogw/. U.S. Geological Survey, 2014c, Publications—Estimated water use in the United States: U.S. Geological Survey Web page, accessed September 1, 2014, at http://water.usgs.gov/watuse/50years.html. Westenbroek, S.M., Kelson, V.A., Dripps, W.R., Hunt, R.J., and Bradbury, K.R., 2010, SWB—A modified Thornthwaite-Mather soil-water-balance code for estimating groundwater recharge: U.S. Geological Survey Techniques and Methods, book 6, chap. A31, 60 p. [Also available at https://pubs.usgs.gov/tm/tm6-a31/.] |
First posted May 5, 2015
Table of Contents |

![]() U.S. Department of the Interior |
U.S. Geological Survey
U.S. Department of the Interior |
U.S. Geological Survey
URL: http://pubsdata.usgs.gov/pubs/ds/0932/report.html
Page Contact Information: GS Pubs Web Contact
Page Last Modified: Monday, 28-Nov-2016 20:34:54 EST
