USGS - science for a changing world

Data Series 1041


Coastal Single-Beam Bathymetry Data Collected in 2015 from Raccoon Point to Point Au Fer Island, Louisiana

Skip Links

Citation Page
Abstract
Introduction
Survey Overview
Data Acquisition
Data Processing
Error Analysis
Survey Products
Data Downloads
Logs
Abbreviations
References Cited
 

Survey Products

Tracklines Bathymetry
Trackline map overview for the 2015 Barrier Island Comprehensive Monitoring single-beam bathymetry survey along the southern coast of Louisiana, from Raccoon Point to Point Au Fer, Louisiana.
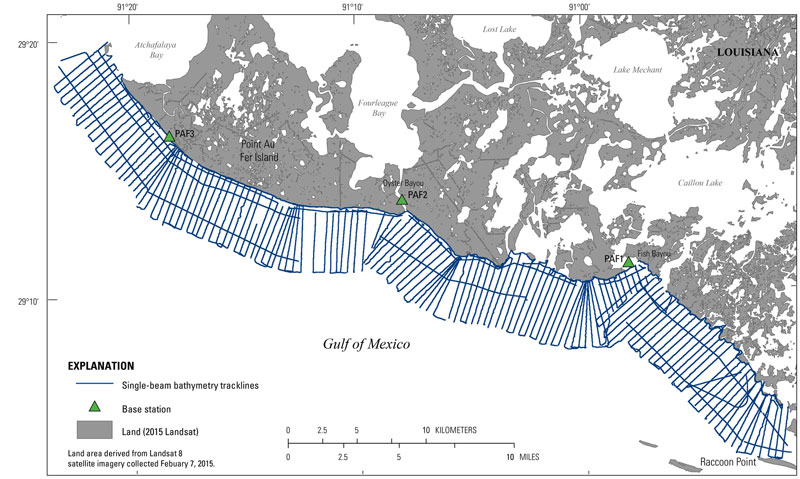
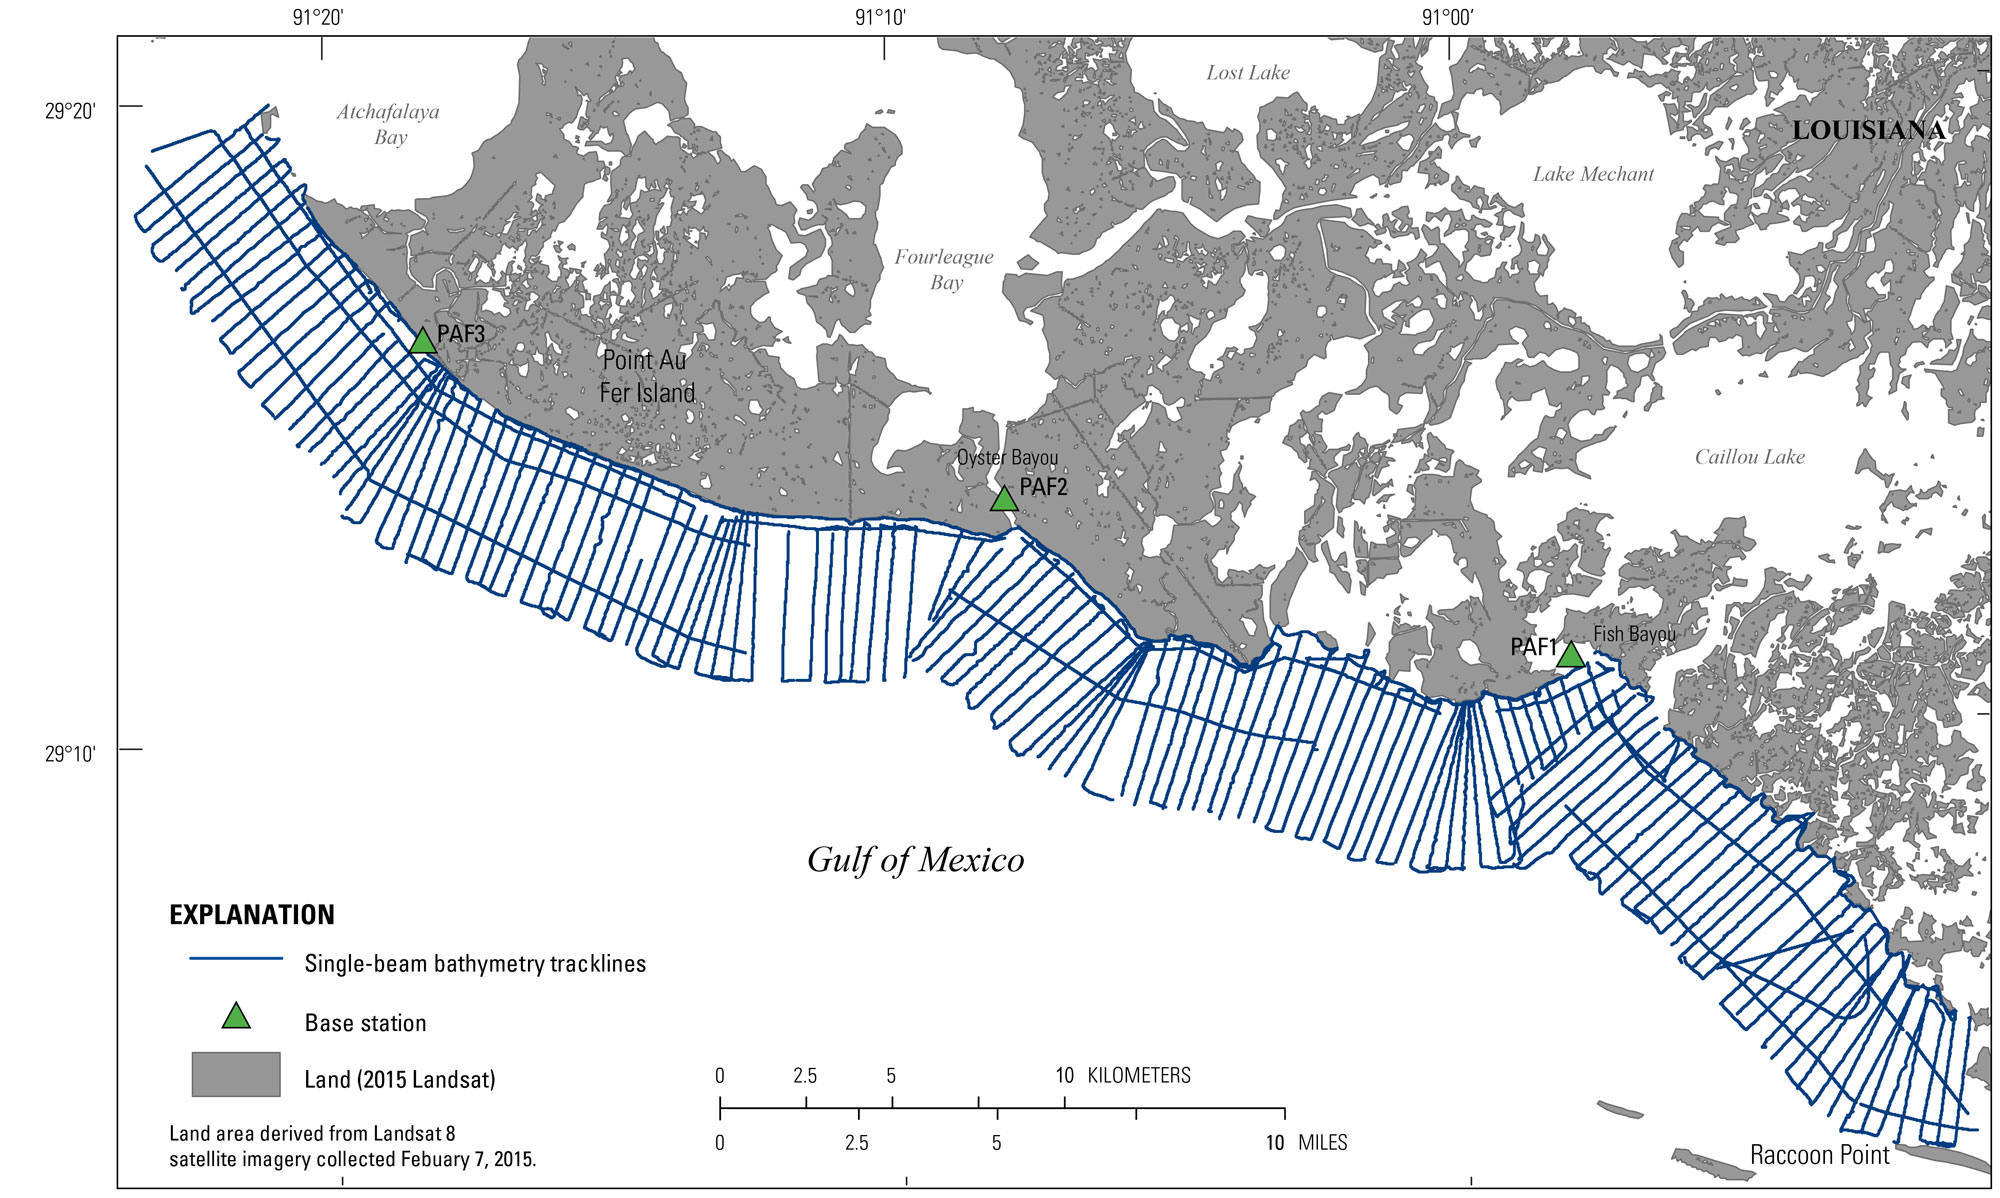
Figure 2. Trackline map overview for the 2015 Barrier Island Comprehensive Monitoring single-beam bathymetry survey along the southern coast of Louisiana, from Raccoon Point to Point Au Fer, Louisiana. [Click figure to enlarge]
The final 200-meter (m) Digital Elevation Model (DEM) for the 2015 Point Au Fer, Louisiana, single-beam bathymetry survey.
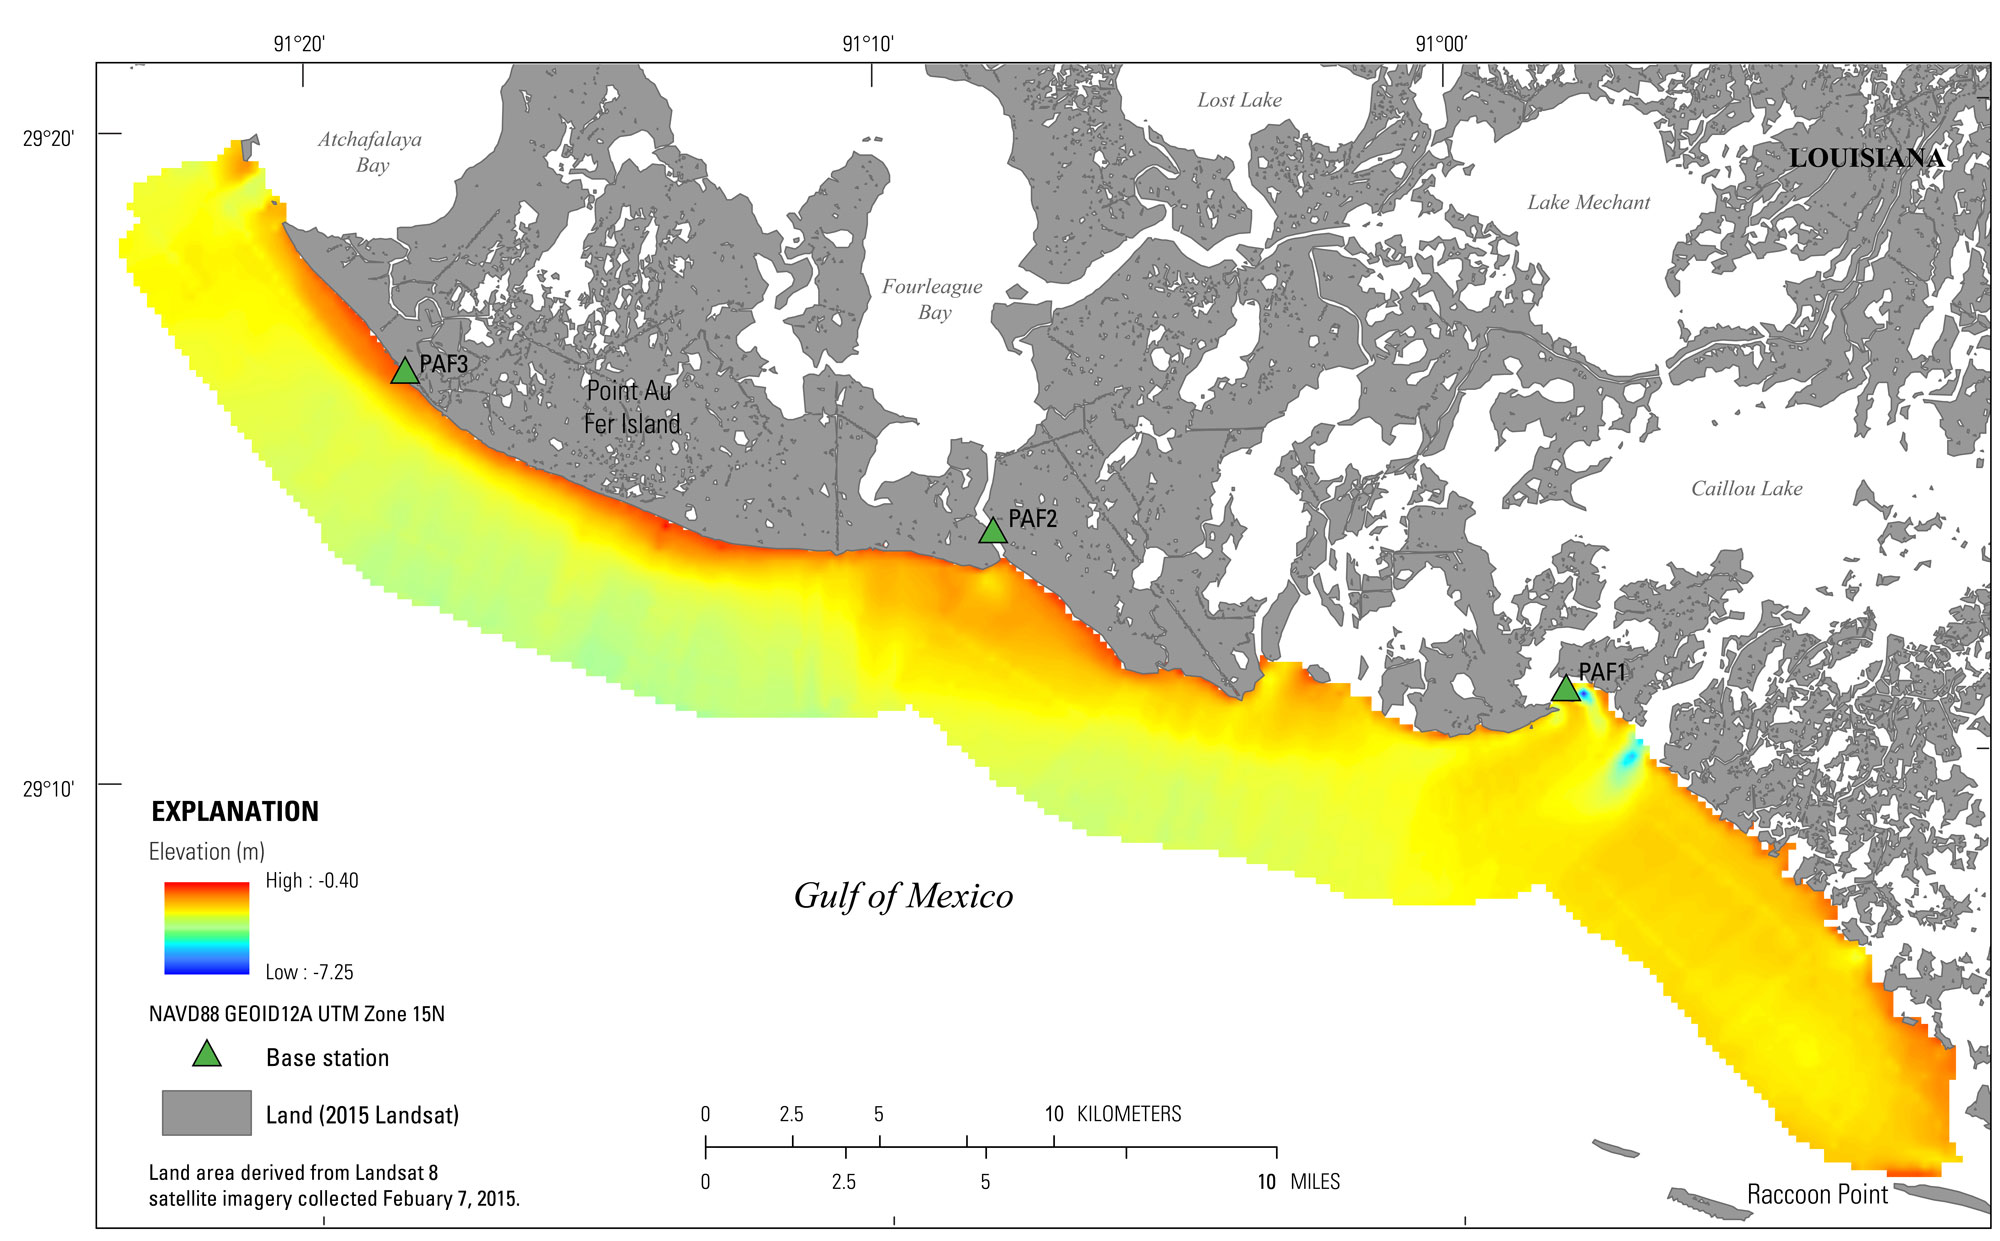
Figure 7. The final 200-meter (m) Digital Elevation Model (DEM) for the 2015 Point Au Fer, Louisiana, single-beam bathymetry survey. Horizontal data is referenced to the North American Vertical Datum of 1983 (NAD83), UTM zone 15 North, and the vertical data is referenced to the North American Vertical Datum 1988 (NAVD88) with respect to GEOID12A. [Click figure to enlarge]
Data acquisition showing in A, a photograph of the R/V Sallenger vessel used for data collection and in B, a trackline map of 307.7 line-km (70 lines) single-beam bathymetry results (USGS SPCMSC cruise identifier 15BIM05).
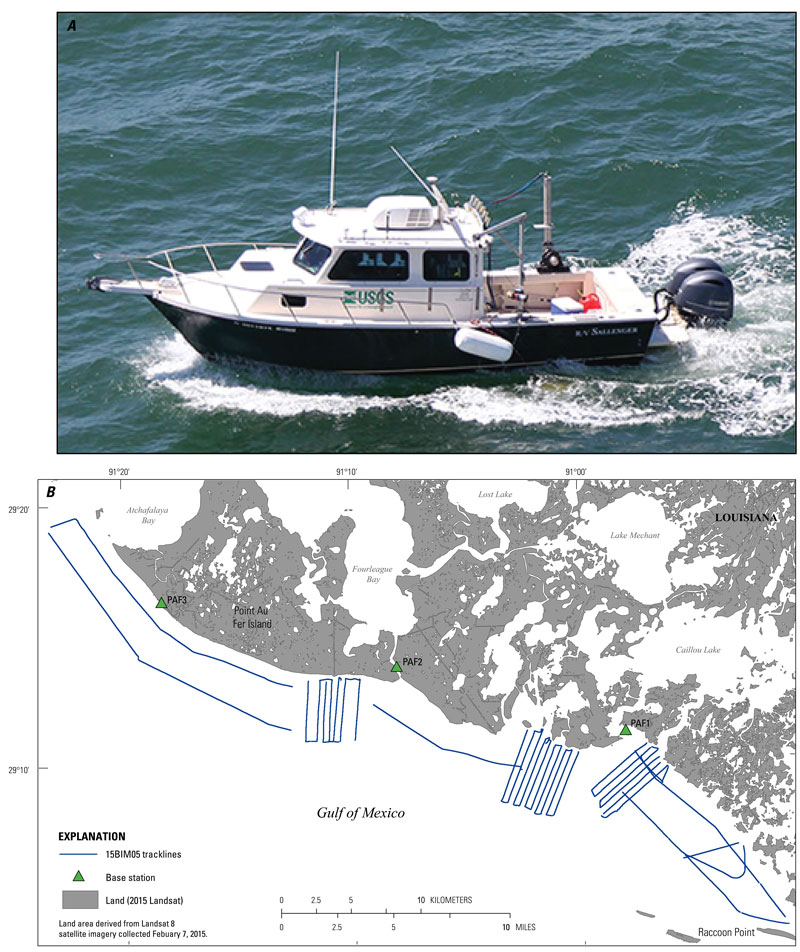
Figure 3. Data acquisition showing in A, a photograph of the R/V Sallenger vessel used for data collection and in B, a trackline map of 307.7 line-km (70 lines) single-beam bathymetry results (USGS SPCMSC cruise identifier 15BIM05). [Click figure to enlarge]
Error values representing the difference between the DEM and the value at each sample point. Points with grid error of +/-0.15 m were made transparent.
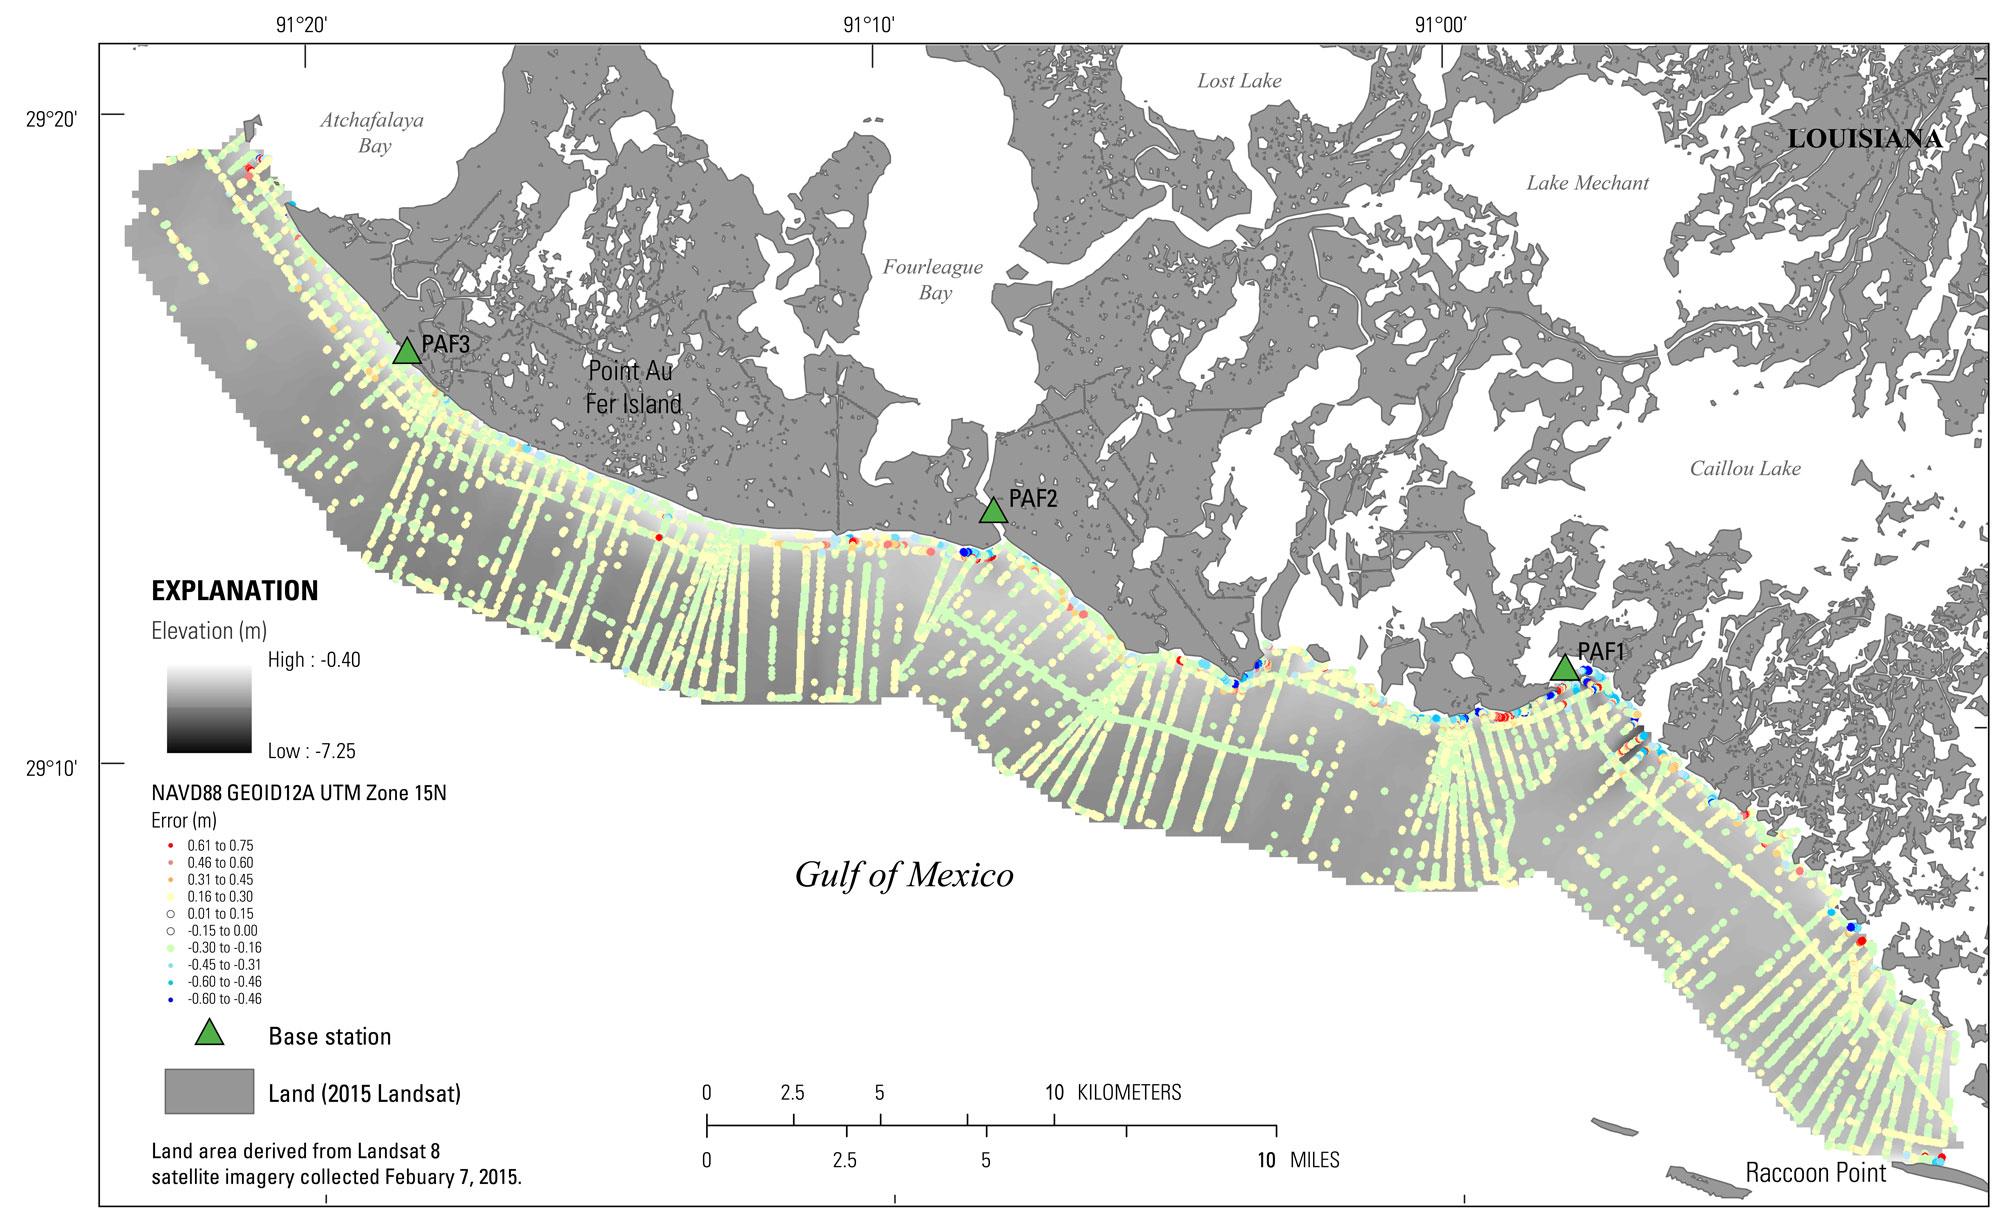
Figure 8. Error values representing the difference between the DEM and the value at each sample point. Points with grid error of +/-0.15 m were made transparent. [Click figure to enlarge]
Data acquisition showing in A, a photograph of the R/V Jabba Jaw vessel used for data collection and in B, a trackline map of 164.4 line-km (34 lines)  single-beam bathymetry results (USGS SPCMSC cruise identifier 15BIM06).
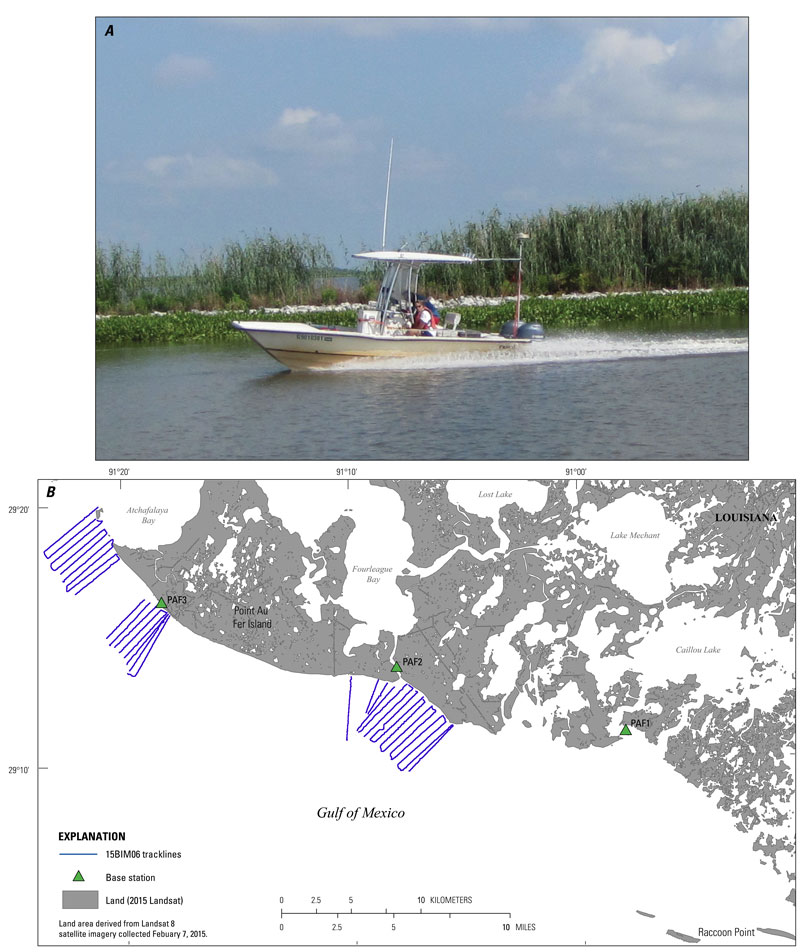
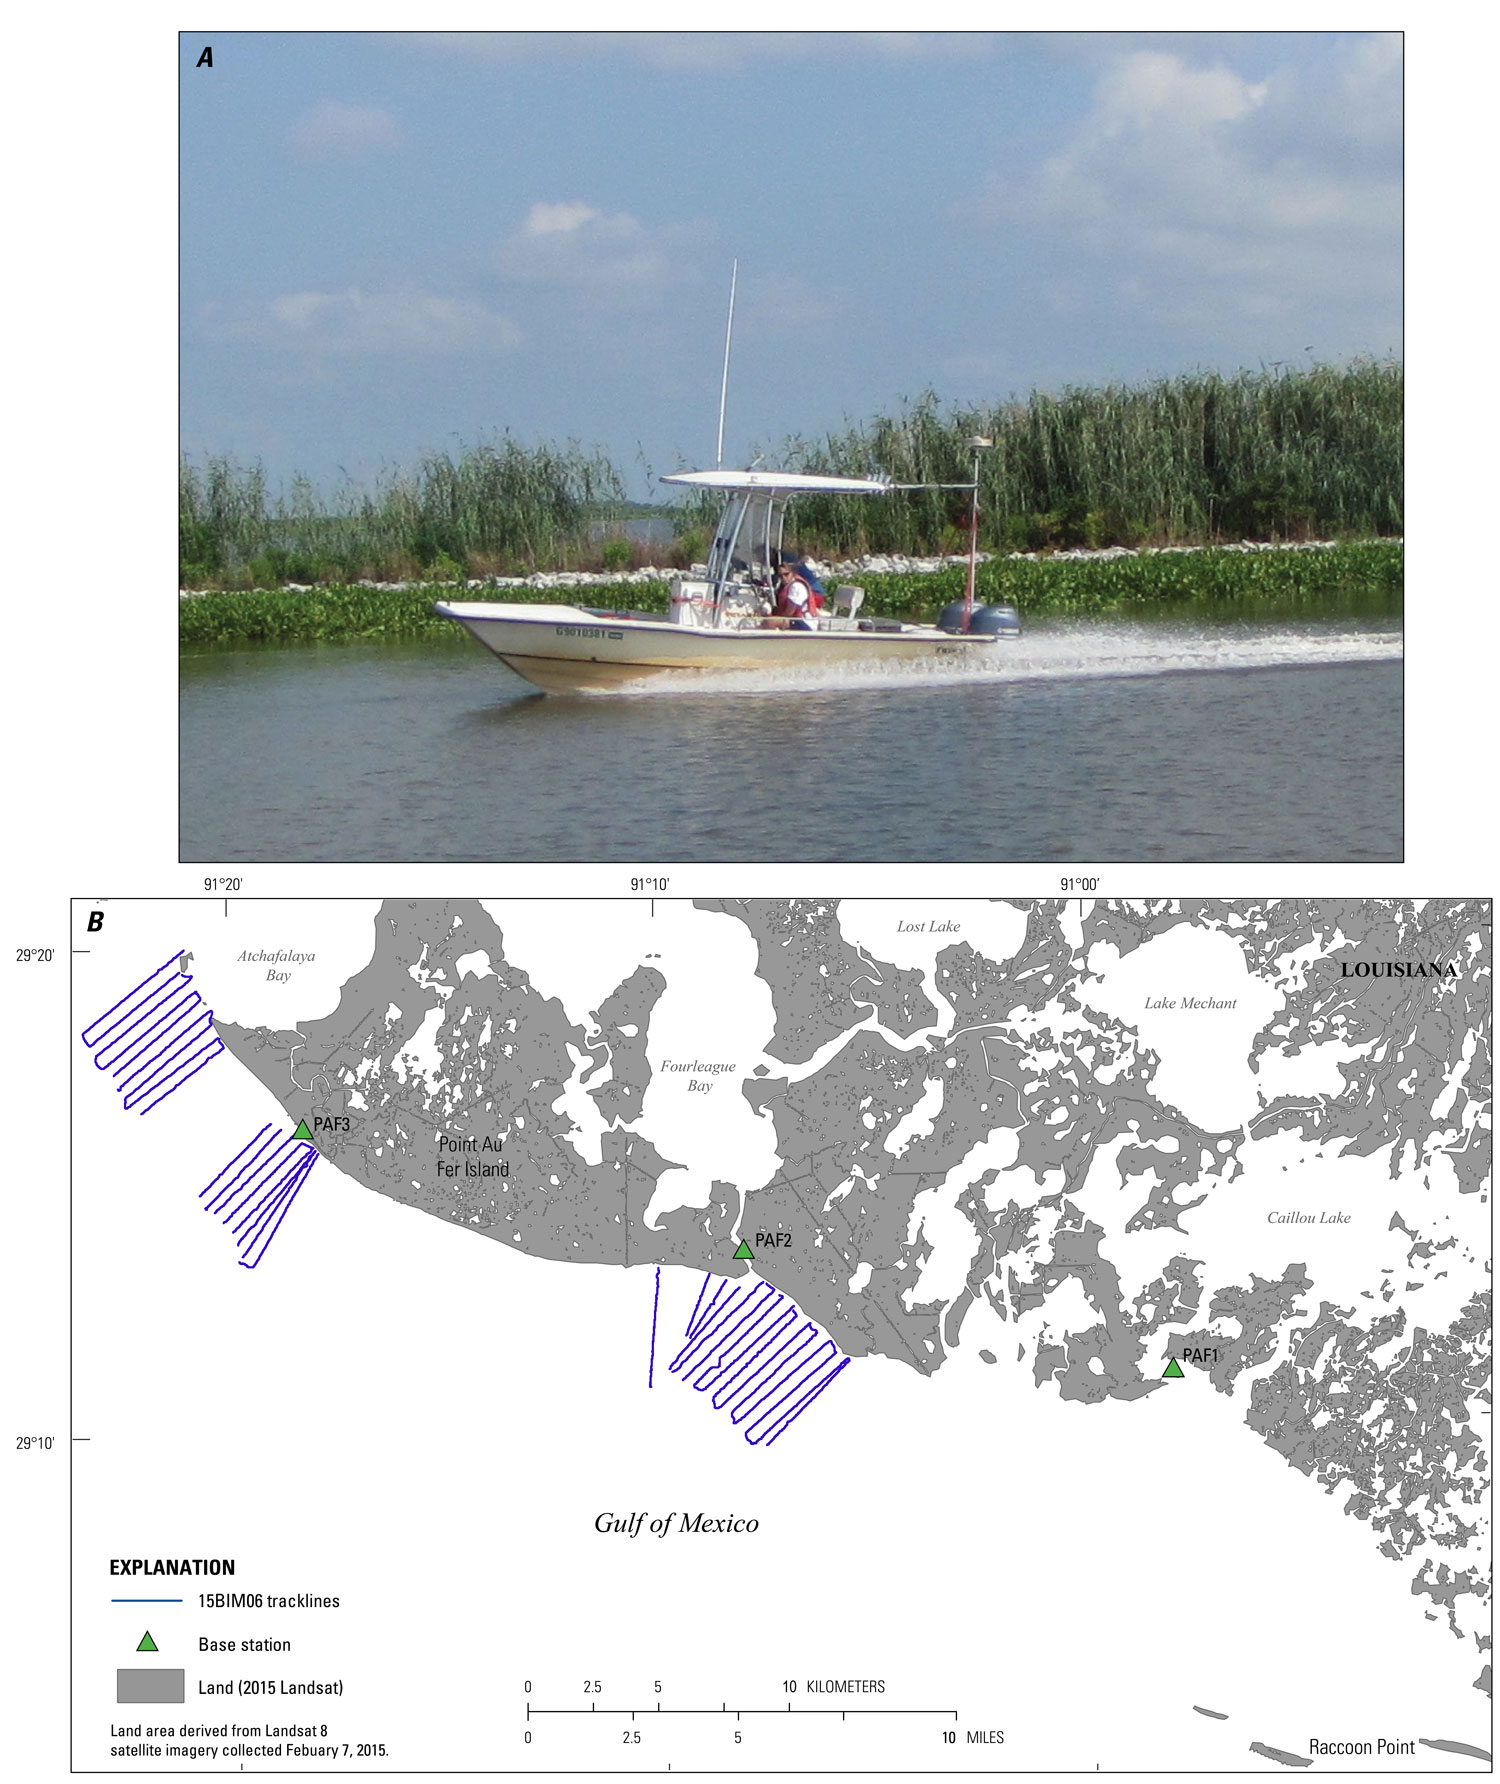
Figure 4. Data acquisition showing in A, a photograph of the R/V Jabba Jaw vessel used for data collection and in B, a trackline map of 164.4 line-km (34 lines) single-beam bathymetry results (USGS SPCMSC cruise identifier 15BIM06). [Click figure to enlarge]
Data acquisition showing in A, a photograph of the R/V Shark vessel used for data collection and in B, a trackline map of 246.7 line-km (72 lines) single-beam bathymetry data results (USGS SPCMSC cruise identifier 15BIM07).
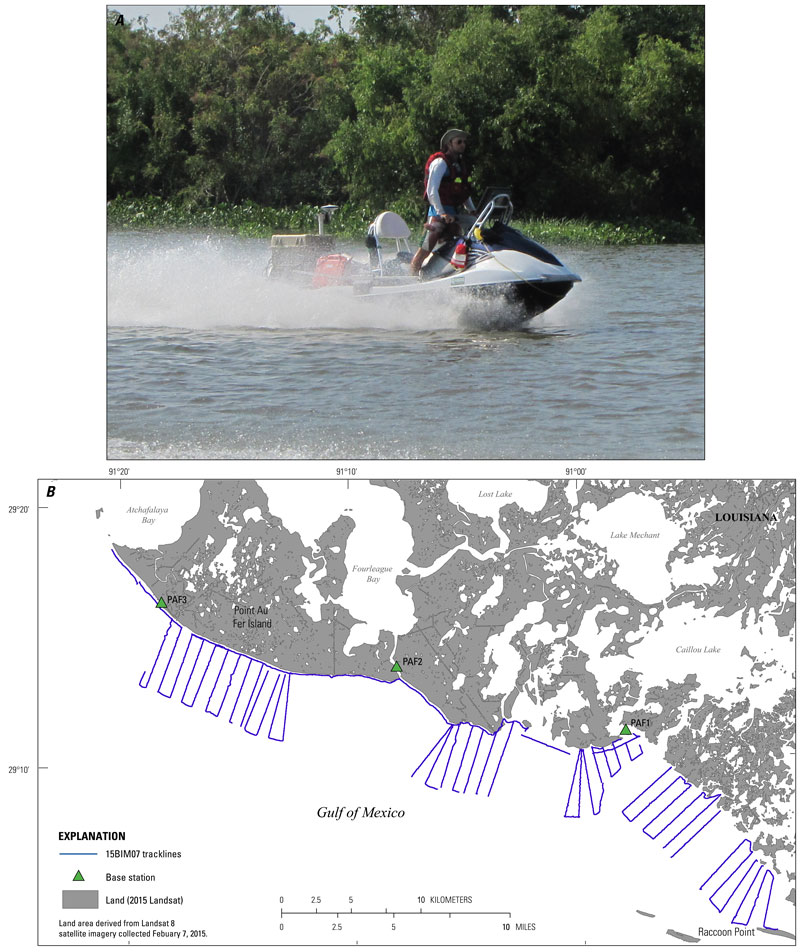
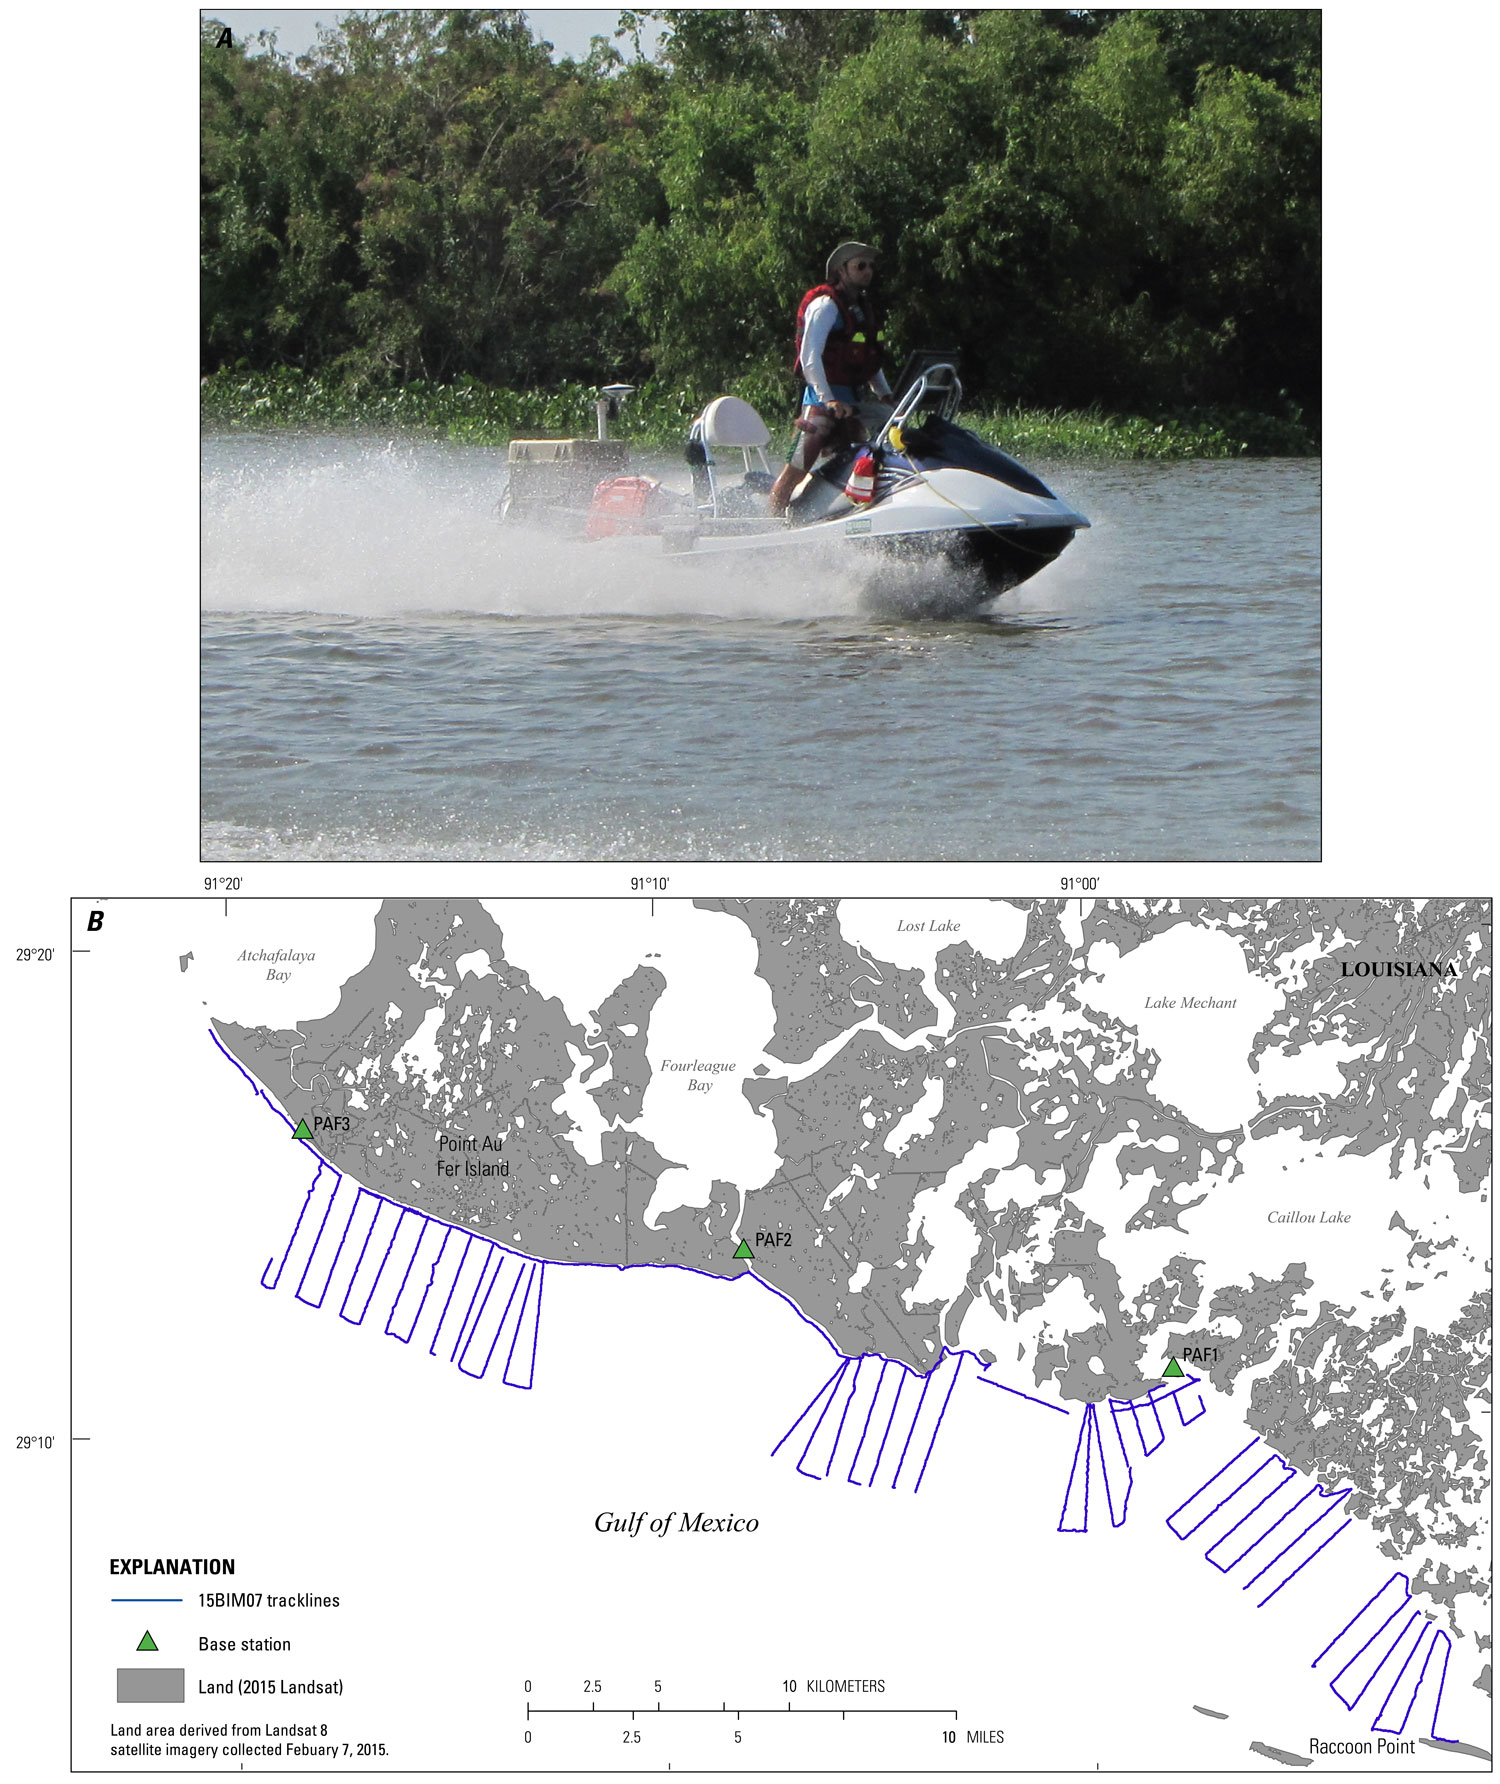
Figure 5. Data acquisition showing in A, a photograph of the R/V Shark vessel used for data collection and in B, a trackline map of 246.7 line-km (72 lines) single-beam bathymetry data results (USGS SPCMSC cruise identifier 15BIM07). [Click figure to enlarge]
Data acquisition showing in A, a photograph of the R/V Chum vessel used for data collection and in B, a trackline map of 392.2 line-km (123 lines) of single-beam bathymetry results (USGS SPCMSC cruise identifier 15BIM08).
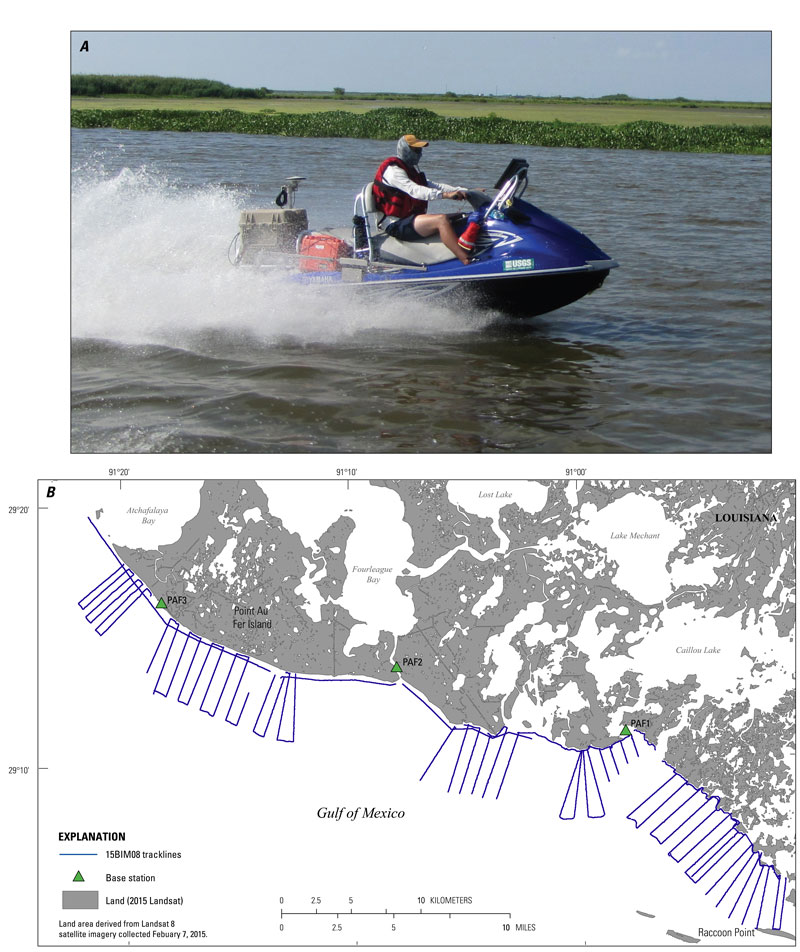
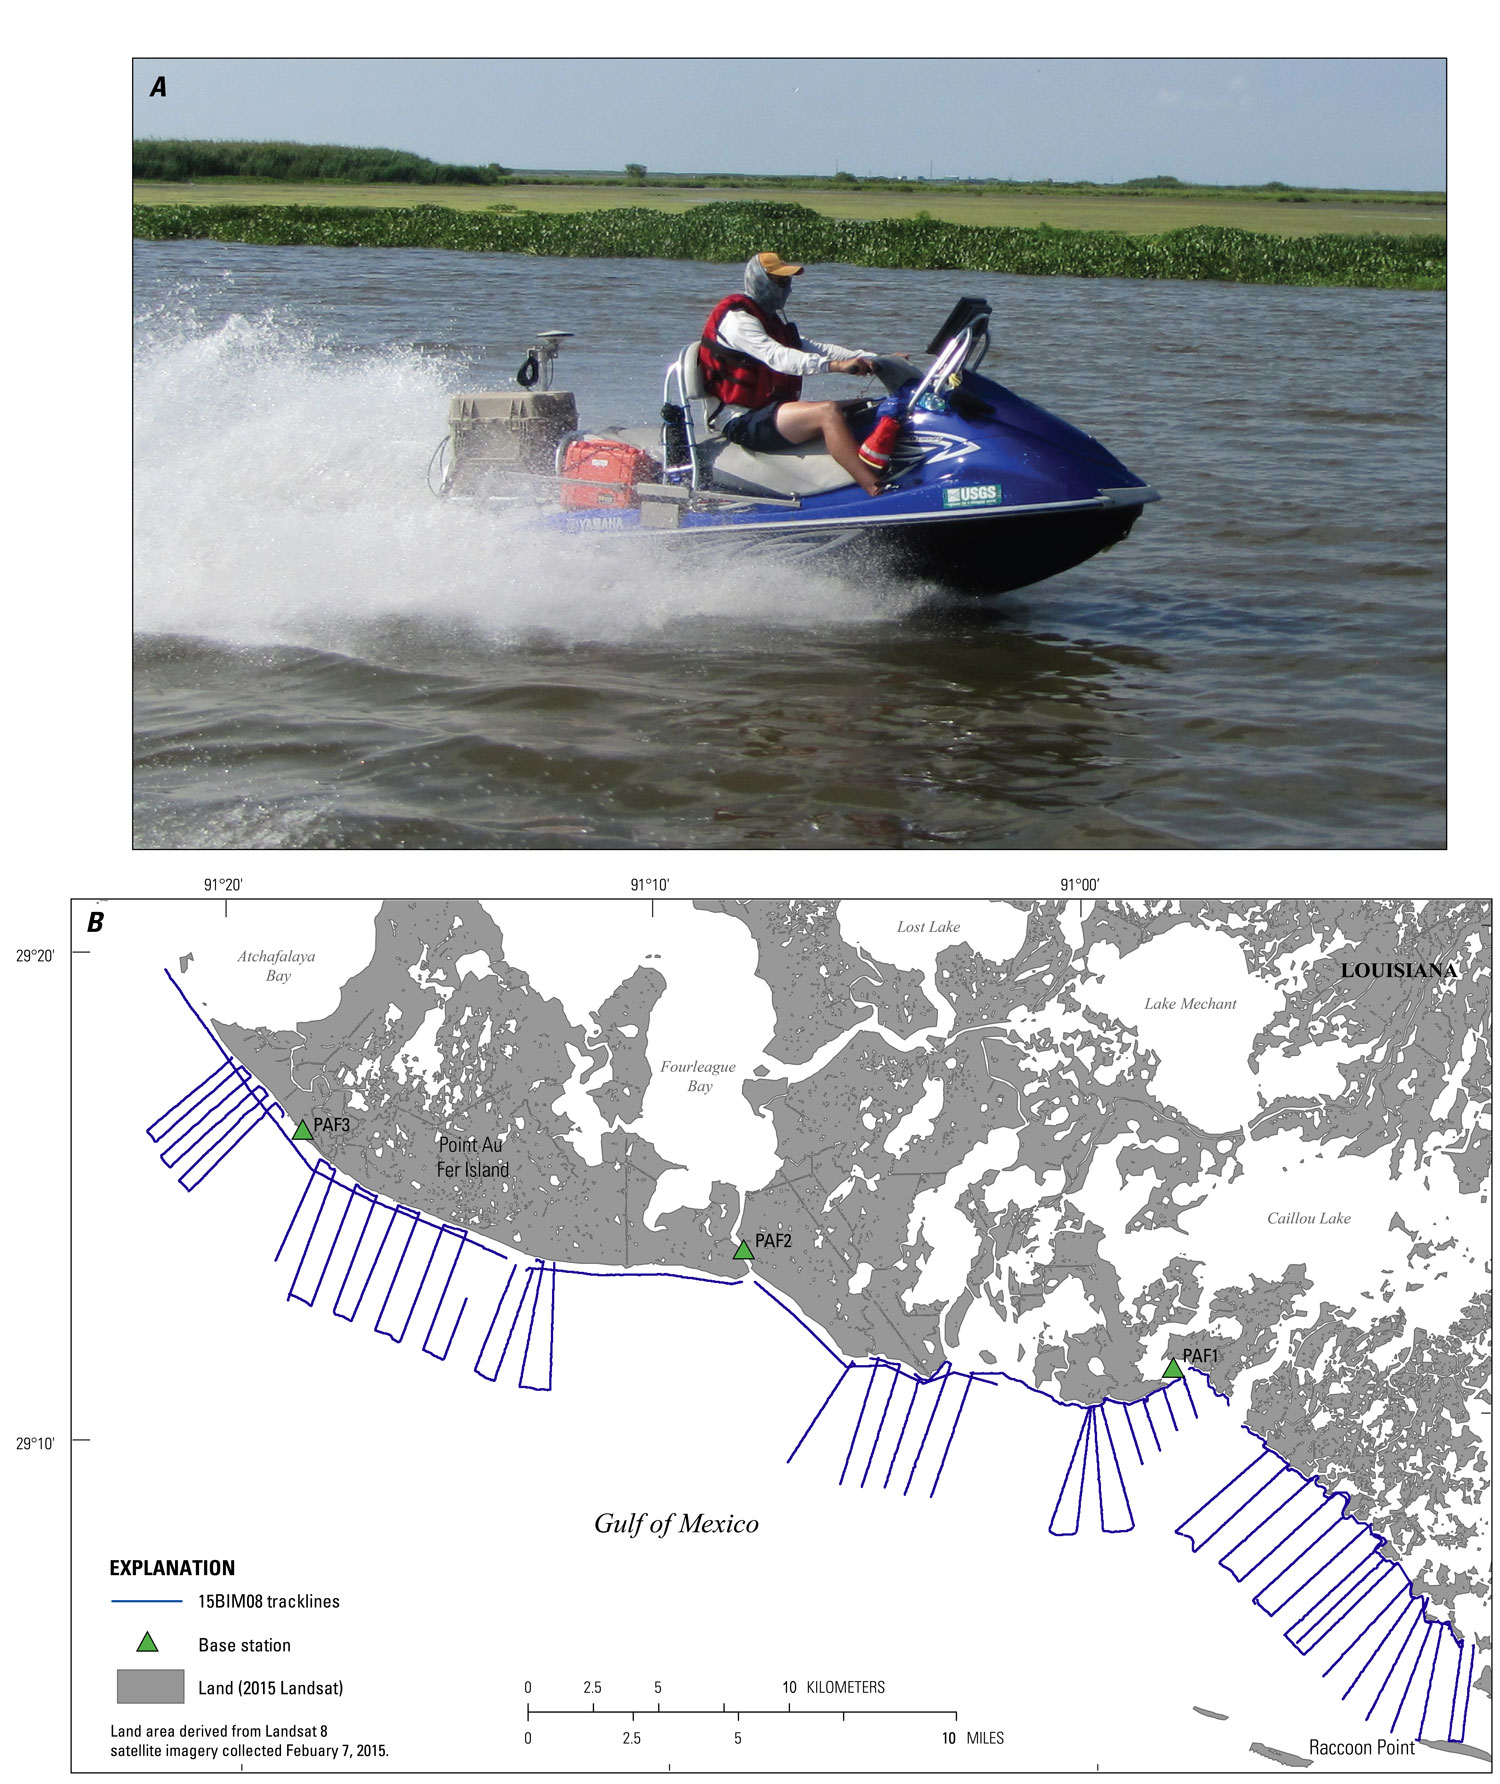
Figure 6. Data acquisition showing in A, a photograph of the R/V Chum vessel used for data collection and in B, a trackline map of 392.2 line-km (123 lines) of single-beam bathymetry results (USGS SPCMSC cruise identifier 15BIM08). [Click figure to enlarge]

Accessibility FOIA Privacy Policies and Notices

Take Pride in America logo USA.gov logo U.S. Department of the Interior | U.S. Geological Survey
URL: http://pubsdata.usgs.gov/pubs/ds/1041/ds1041_survey_products.html
Page Contact Information: GS Pubs Web Contact
Page Last Modified: Thursday, 09-Mar-2017 09:15:13 EST