Data Series 1059
| Field Data Collection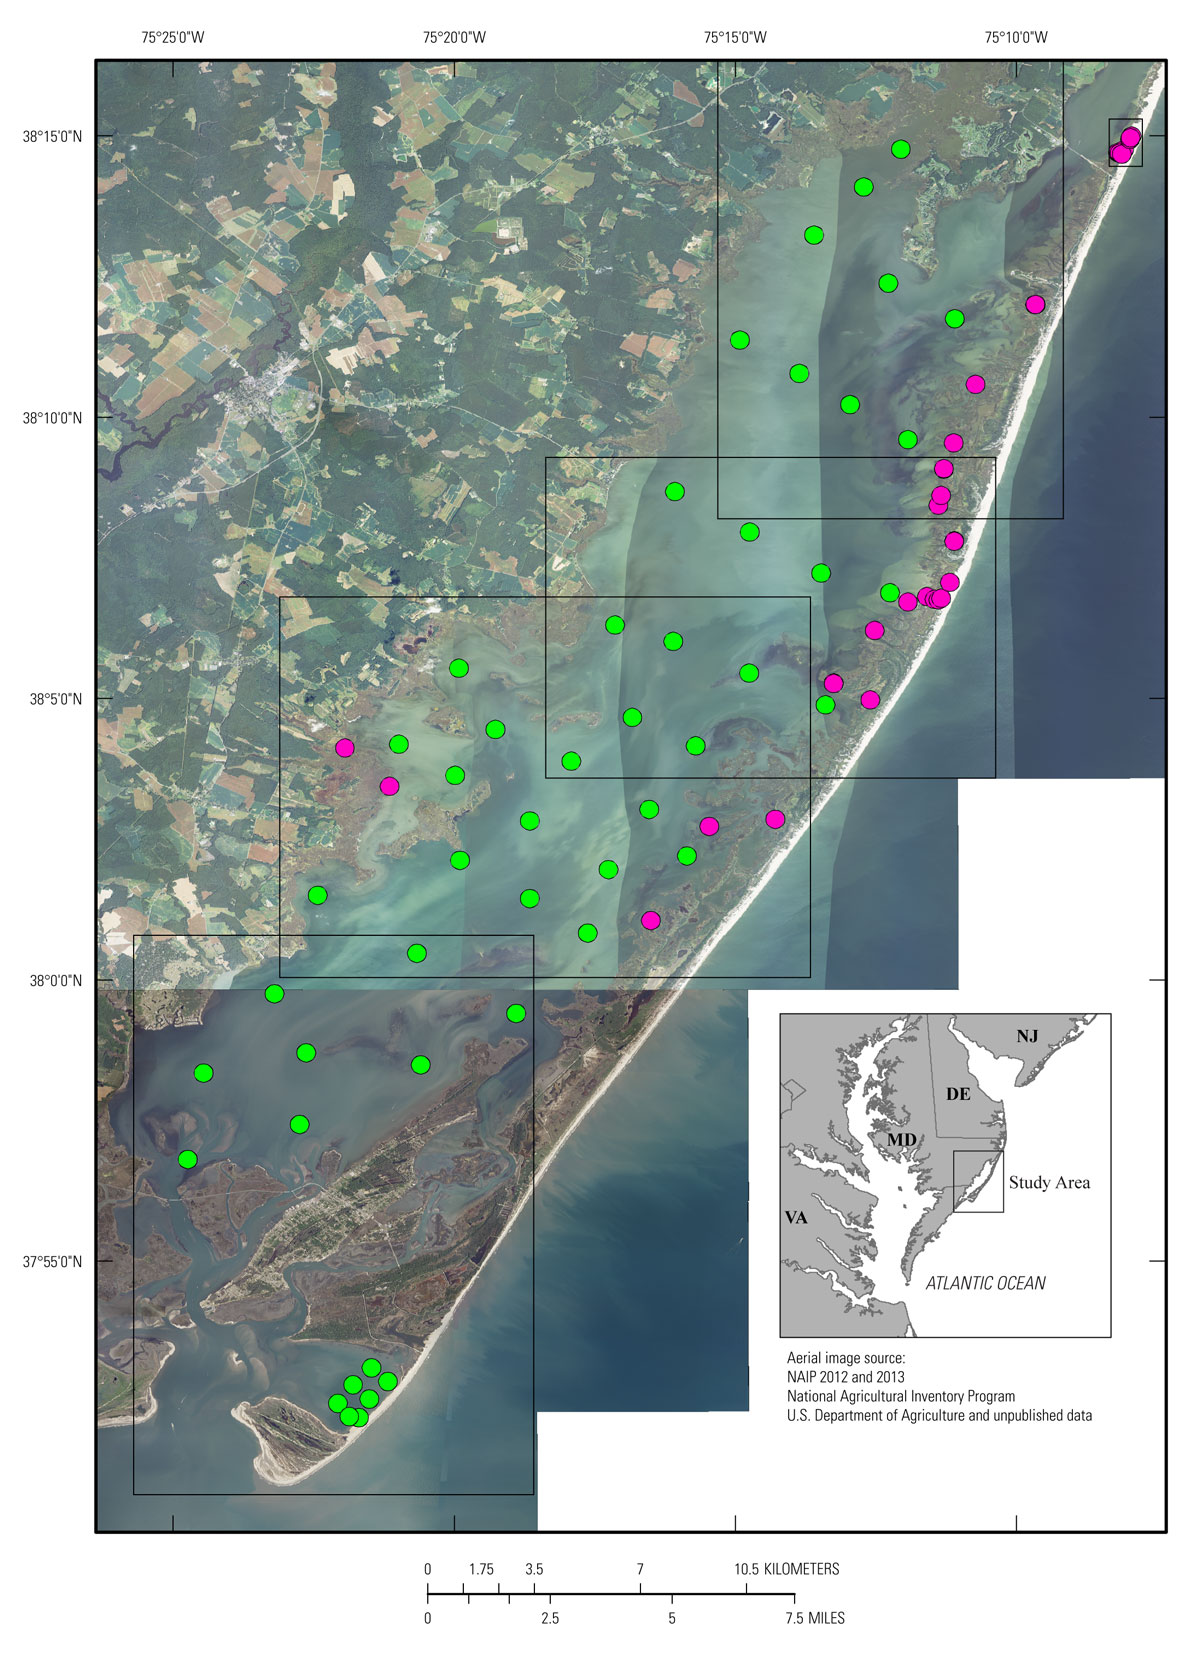 Figure 2. Aerial map showing the sample sites within Chincoteague Bay and Tom's Cove along the eastern shore of Maryland and Virginia. Click inside the black-outlined boxes for an enlarged aerial imagery view of sample locations. Green dots represent estuarine grab samples, while pink dots represent land surface samples. All sites are labeled with the corresponding sample number from the spring sampling trip unless the sample was not a seasonal replicate and was only collected in the fall, in which case it is labeled with the fall sample number. [Click to enlarge]
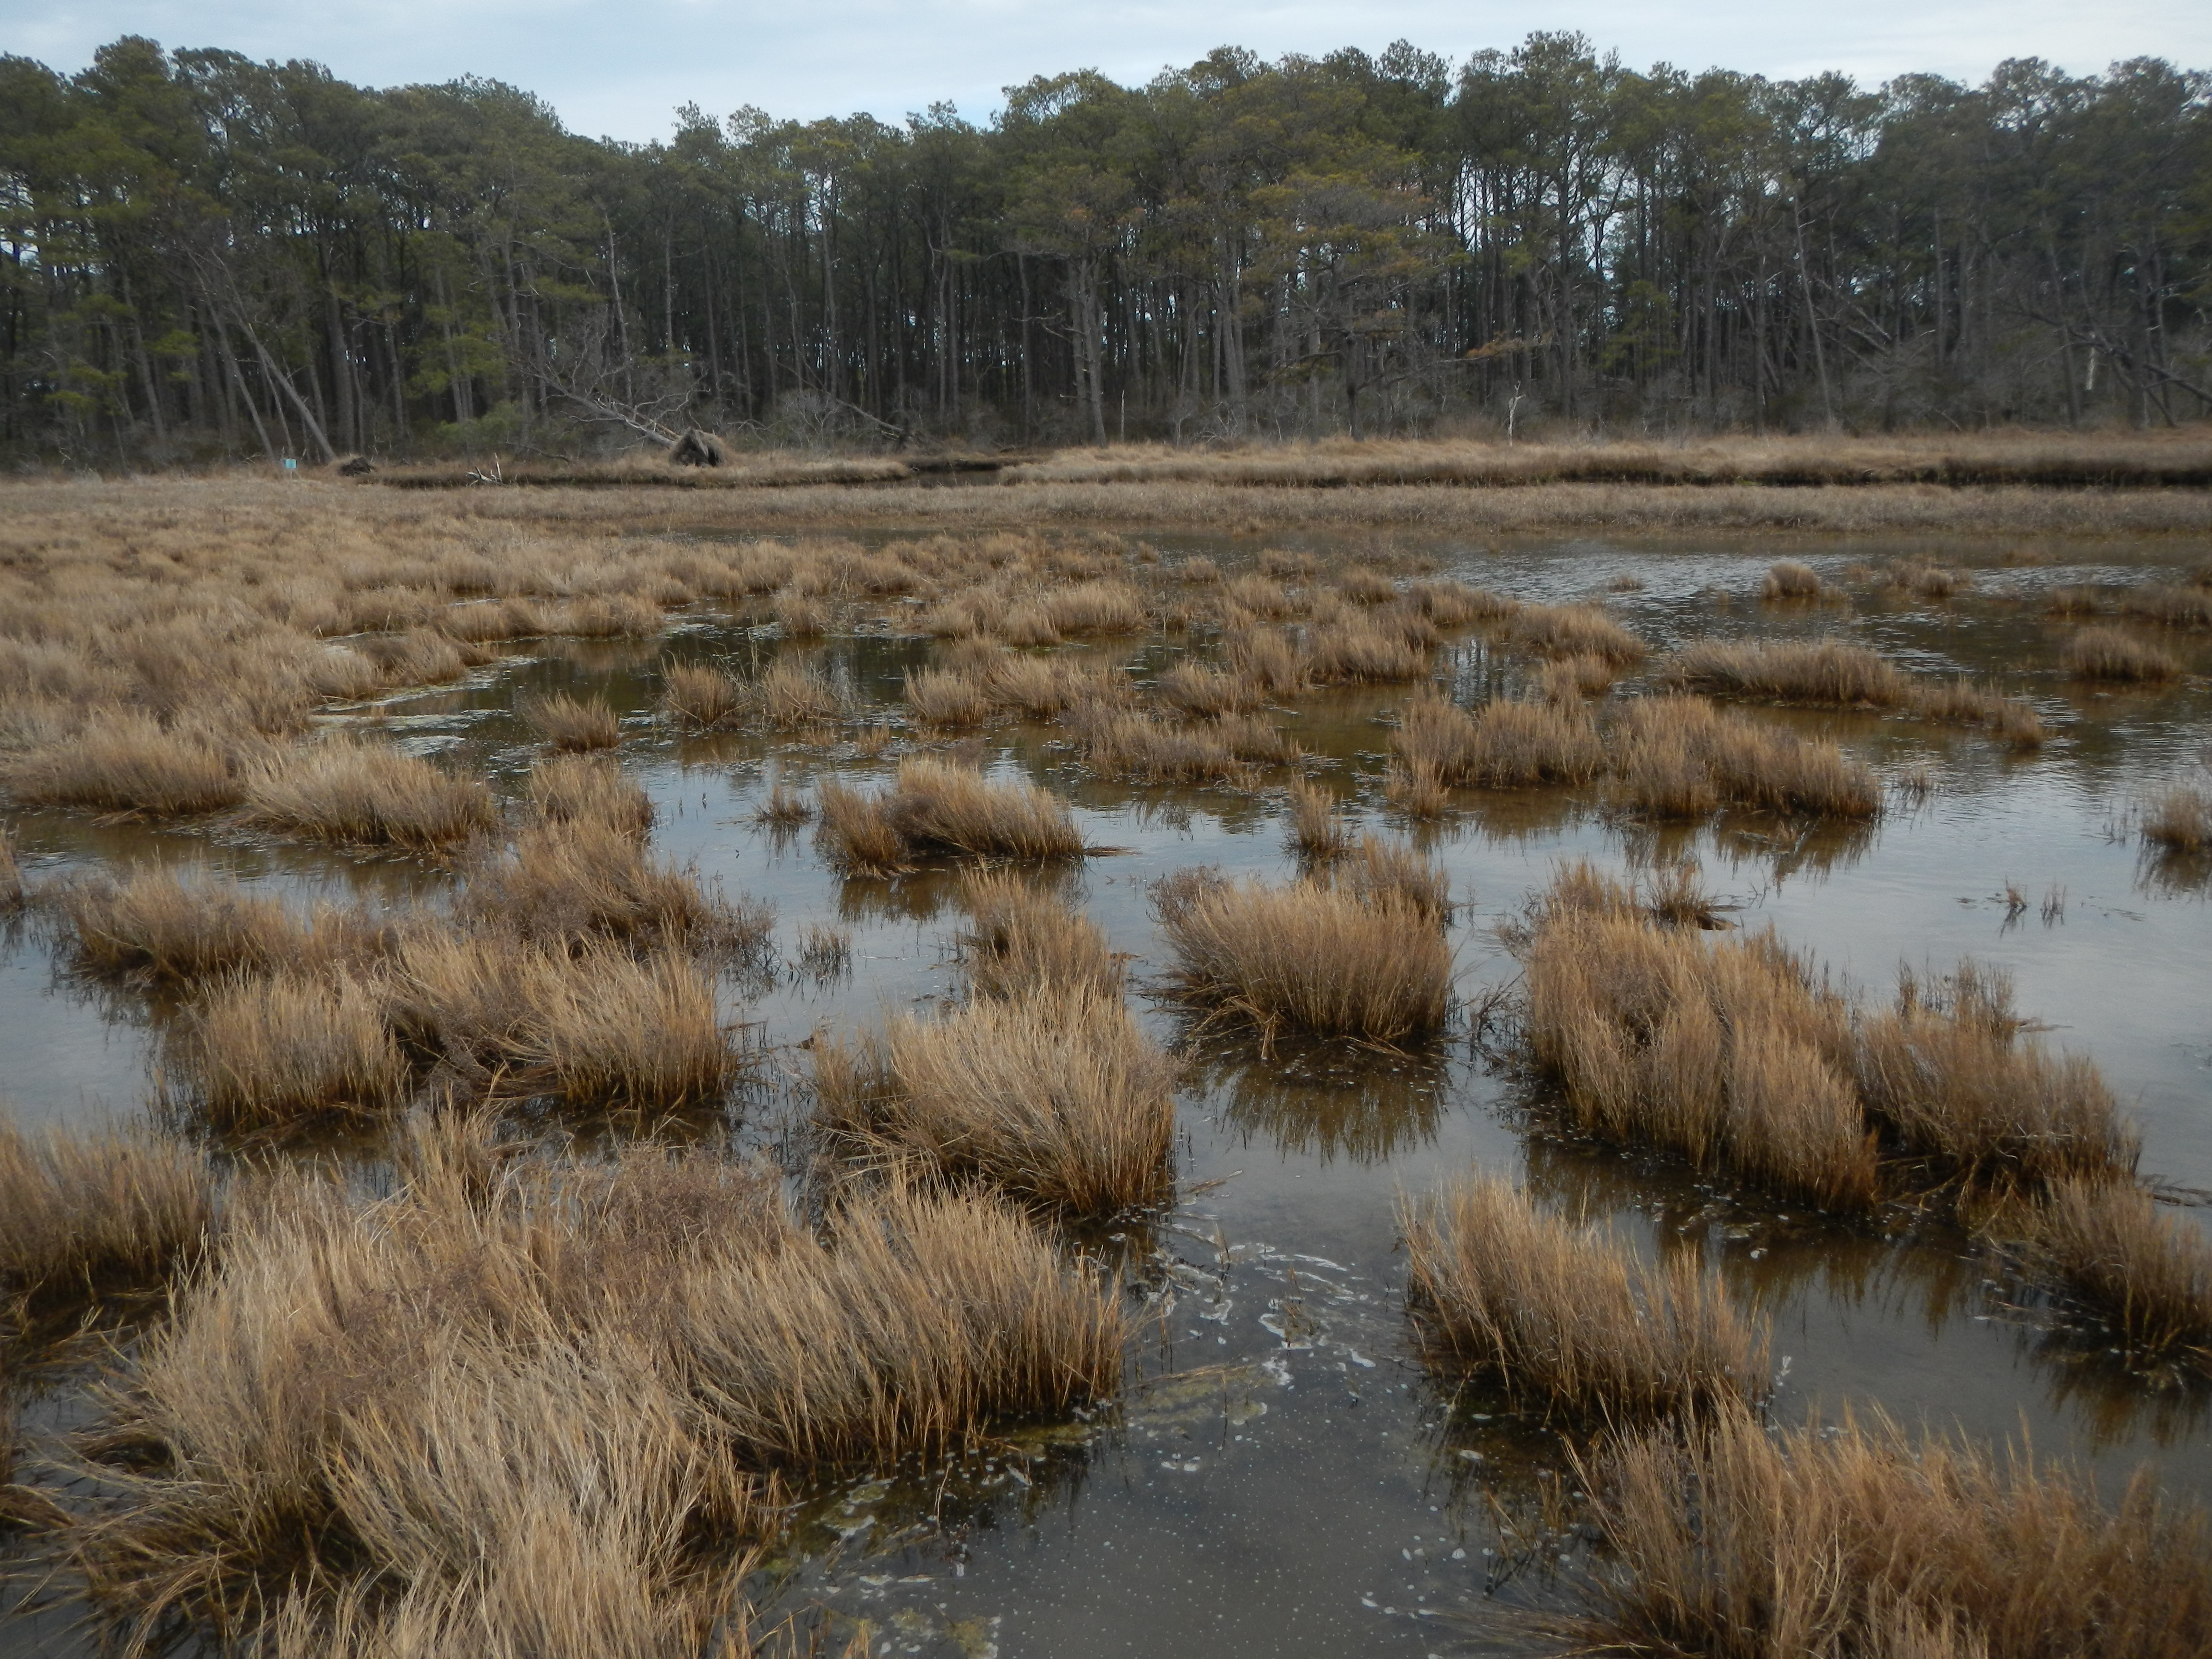
Estuarine grab samples (denoted with a “G”) were collected in the field using a petite Ponar in the spring (March 26–April 4) and fall (October 21–30) of 2014 (USGS Field Activity Numbers (FAN) 2014–301–FA and 2014–322–FA, respectively). During the same time periods, surface samples were collected on land from marsh and sandy overwash environments (denoted with an “S”) by scraping the surface of the land. Spring estuarine and surface site and sample identifications were numbered 01–103. In the fall, the majority of the sites were revisited, and the sample identification numbers were increased by a factor of 300 (for example, spring sample site 15S corresponds with fall sample site 315S). At each site, sediment was collected for sediment characterization (20–30 milliliters (mL) for grain-size, bulk density, water content, LOI, δ13C and δ15N, and metals), micropaleontology (15–20 mL), and archive (10 mL). At each land surface site, an accurate elevation and location were acquired using an Ashtech Z-Xtreme Global Positioning System (GPS) receiver and geodetic antenna with site occupation lengths between 5 and 30 minutes. At all estuarine grab sites, coordinates were recorded on a Garmin GPSmap 76S, and water quality parameters were collected 1 meter (m) below the water surface with a YSI Professional Plus Multiparameter Instrument. Parameters collected by the YSI include salinity, pH, temperature, dissolved oxygen (DO), specific conductance, and oxidation-reduction potential (ORP). Water depth was also recorded at each sample site using a Garmin depth sounder or by direct measurement at the time of collection. No modifications were made to the data set to compensate for fluctuating tidal stages. For more detailed information regarding field methods, please refer to Ellis and others, 2015, and Smith and others, 2015.
|

![]() U.S. Department of the Interior |
U.S. Geological Survey
U.S. Department of the Interior |
U.S. Geological Survey
URL: http://pubsdata.usgs.gov/pubs/ds/1059/ds1059_data-collection.html
Page Contact Information: GS Pubs Web Contact
Page Last Modified: Wednesday, 01-Nov-2017 12:11:33 EDT