DS 232: Texas Bouguer Gravity Anomaly Map
|
Northeast Illumination
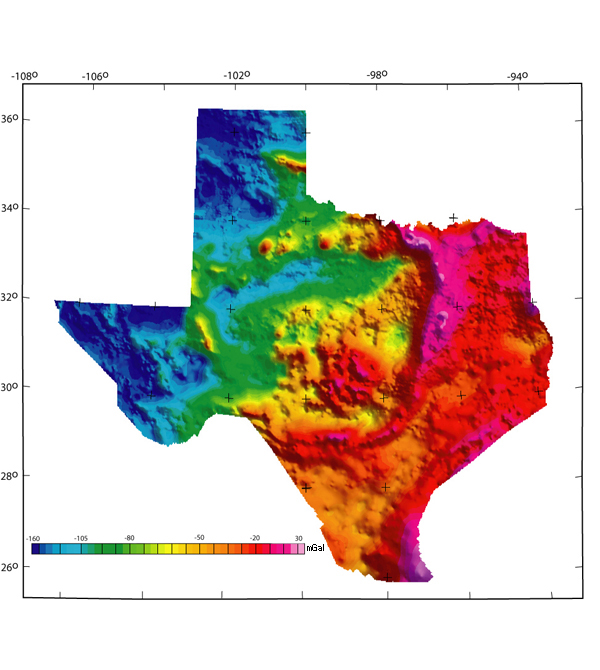
The colors on this Bouguer gravity anomaly map represent gravity variations resulting from lateral density variations in the Earth. Positive anomalies (red colors) occur in areas with average density greater than the Bouguer reduction density of 2.67 g/cc, whereas negative anomalies (blue colors) occur in areas of lower density. The complete-Bouguer gravity anomaly grid was generated from over 76,000 gravity station measurements in and adjacent to the state of Texas. These data were extracted from the gravity database maintained by the National Geophysical Data Center (from Department of Defense unclassified data) (Hittleman and others, 1994) and augmented with data from the USGS and from several university theses and dissertations. Observed gravity measurements relative to the IGSN-71 datum were reduced to the Bouguer anomaly using the 1967 gravity formula (Cordell and others, 1982) and a reduction density of 2.67 g/cc. Terrain corrections were calculated radially outward from each station to a distance of 167 km using a method developed by Plouff (1977). The data were converted to a 2-km grid using minimum curvature techniques.Grids for this map in various formats are listed in the data directory using a prefix of 'texas_cbggrav'. |
For additional information contact: |

![]() U.S. Department of the Interior |
U.S. Geological Survey
U.S. Department of the Interior |
U.S. Geological Survey
URL: http://pubsdata.usgs.gov/pubs/ds/2006/232/texas_boug.htm
Page Contact Information: GS Pubs Web Contact
Page Last Modified: Monday, 28-Nov-2016 12:01:52 EST