DS 234: Bouguer Gravity Map
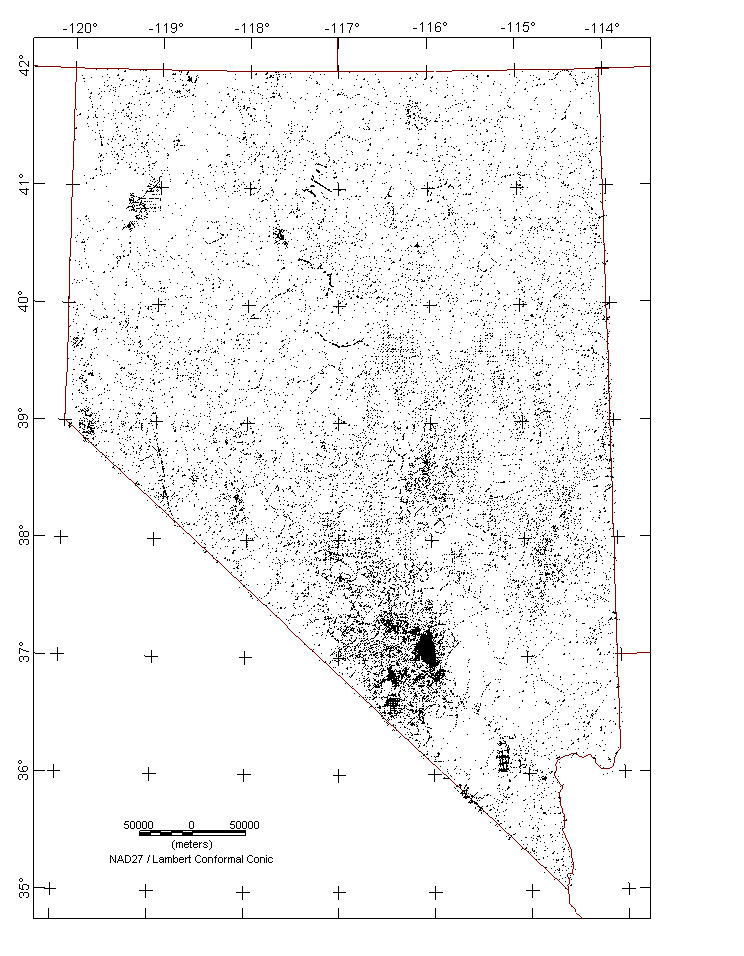
Northeast Illumination The complete Bouguer gravity anomaly grid was generated from 71,055 gravity station measurements in and adjacent to the State of Nevada. The source of the station information is the 1997 USGS publication Digital Data Series DDS-42 by David A. Ponce. Another source of gravity data is the University of Texas-El Paso (UTEP) / PACES research center. Observed gravity measurements relative to the International Gravity Standardization Net 1971 (IGSN71) datum were reduced to the Bouguer anomaly using the 1967 gravity formula (Cordell and others, 1982) and a reduction density of 2.67 gm/cc. Terrain corrections were calculated radially outward from each station to a distance of 167 km using a method developed by Plouff (1977) which produces the complete Bouguer anomaly. The data were converted to a 1-km grid using minimum curvature techniques. Contact David Ponce for availability of these and any updated station data as well as reduction details for Nevada gravity. This compilation does not include any unpublished data.
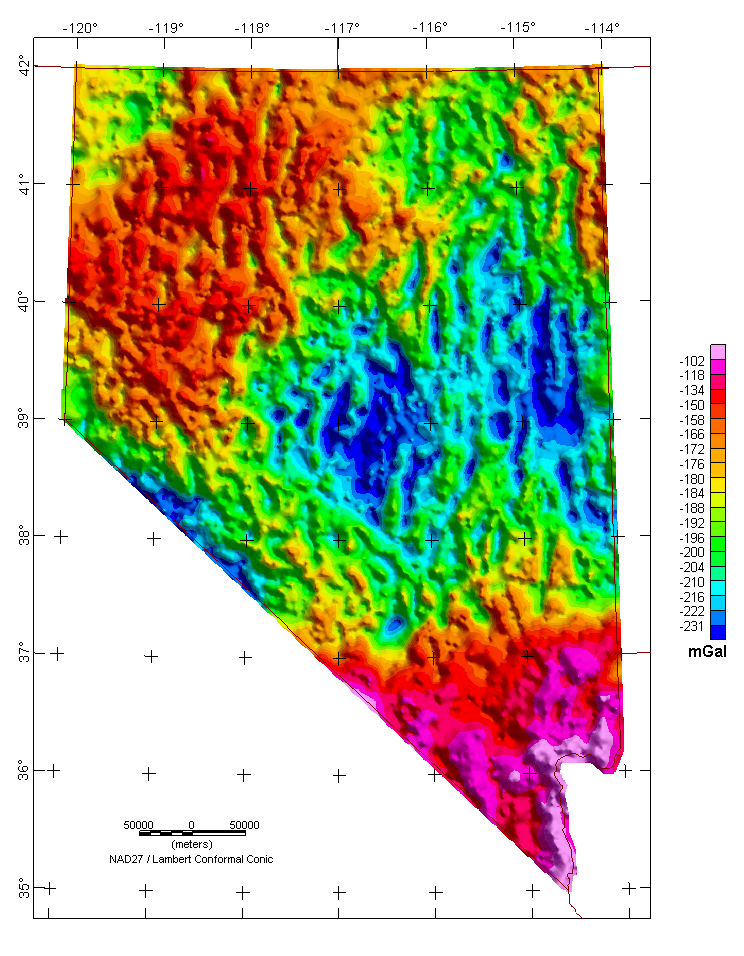
The colors on this complete Bouguer gravity anomaly (Bankey and others, 1995) map represent gravity variations resulting from lateral density variations in the Earth. The more positive anomalies (red colors) occur in areas with average density greater than the Bouguer reduction density of 2.67 gm/cc, whereas the more negative anomalies (blue colors) occur in areas of lower density. The color scale used to create this image is non-linear to best represent the range of values. The grid for the complete Bouguer color-contour map is available from the data directory as grvcba.grd
|
Version 1.0 Posted December 2006 |
For more information about this report contact: Bob Kucks