Data Series 355
Oregon Isostatic Gravity Anomaly MapNortheast Illumination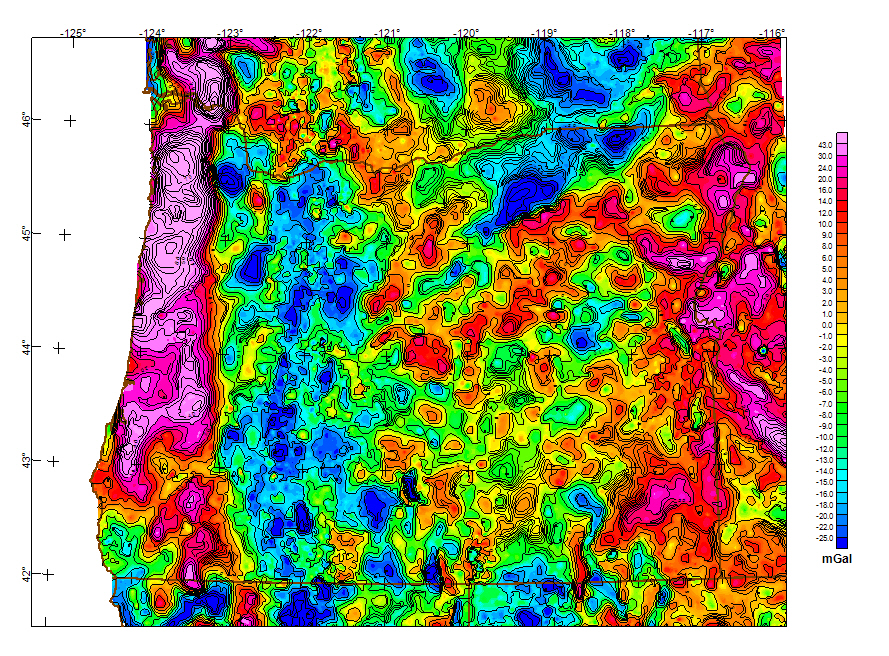
The colors on this isostatic residual gravity map (Bankey and others, 1995) reflect variations in the Earth's gravity field caused by density variations in the rocks composing the upper part of the Earth's crust. An isostatic residual gravity grid was derived from the complete Bouguer gravity anomaly data by removing the gravitational effect of the compensating mass that supports topographic loads. The thickness of this compensating mass was calculated using averaged digital topography by assuming a crustal thickness for sea-level topography of 25 km (~15.5 mi), a crustal density of 2.67 gm/cc, and a density contrast between the crust and upper mantle of 0.40 gm/cc. The anomalies and patterns on the map reveal features of subsurface geology, including the location of buried faults, sedimentary basins, plutons, uplifted basement rocks, and so forth. The more positive anomalies (red colors) delineate rocks more dense than the Bouguer reduction density of 2.67 gm/cc, whereas the more negative anomalies (blue colors) result from rocks of lower density. The color scale used to create this image is non-linear to best represent the range of values. The grid for this map is available from the data directory as grviso.grd |
Version 1.0 Posted August 2008
Contains: gridded data. Refer to the Readme file for more information.
For additional information about this report, contact: Bob Kucks |

![]() U.S. Department of the Interior | U.S. Geological Survey
U.S. Department of the Interior | U.S. Geological Survey
URL: http://pubsdata.usgs.gov/pubs/ds/355/or_iso.htm
Questions or Assistance: Contact USGS
Last modified: Monday, 28-Nov-2016 13:03:25 EST
