Fact Sheet 002-00
IntroductionGlobal sea level and the Earth’s climate are closely linked. The Earth’s climate has warmed about 1°C (1.8°F) during the last 100 years. As the climate has warmed following the end of a recent cold period known as the “Little Ice Age” in the 19th century, sea level has been rising about 1 to 2 millimeters per year due to the reduction in volume of ice caps, ice fields, and mountain glaciers in addition to the thermal expansion of ocean water. If present trends continue, including an increase in global temperatures caused by increased greenhouse-gas emissions, many of the world’s mountain glaciers will disappear. For example, at the current rate of melting, most glaciers will be gone from Glacier National Park, Montana, by the middle of the next century (fig. 1). In Iceland, about 11 percent of the island is covered by glaciers (mostly ice caps). If warming continues, Iceland’s glaciers will decrease by 40 percent by 2100 and virtually disappear by 2200. 
Figure 1. Grinnell Glacier in Glacier National Park, Montana; photograph by Carl H. Key, USGS, in 1981. The glacier has been retreating rapidly since the early 1900’s. The arrows point to the former extent of the glacier in 1850, 1937, and 1968. Mountain glaciers are excellent monitors of climate change; the worldwide shrinkage of mountain glaciers is thought to be caused by a combination of a temperature increase from the Little Ice Age, which ended in the latter half of the 19th century, and increased greenhouse-gas emissions. Most of the current global land ice mass is located in the Antarctic and Greenland ice sheets (table 1). Complete melting of these ice sheets could lead to a sea-level rise of about 80 meters, whereas melting of all other glaciers could lead to a sea-level rise of only one-half meter. Glacial-Interglacial CyclesClimate-related sea-level changes of the last century are very minor compared with the large changes in sea level that occur as climate oscillates between the cold and warm intervals that are part of the Earth’s natural cycle of long-term climate change. During cold-climate intervals, known as glacial epochs or ice ages, sea level falls because of a shift in the global hydrologic cycle: water is evaporated from the oceans and stored on the continents as large ice sheets and expanded ice caps, ice fields, and mountain glaciers. Global sea level was about 125 meters below today’s sea level at the last glacial maximum about 20,000 years ago (Fairbanks, 1989). As the climate warmed, sea level rose because the melting North American, Eurasian, South American, Greenland, and Antarctic ice sheets returned their stored water to the world’s oceans. During the warmest intervals, called interglacial epochs, sea level is at its highest. Today we are living in the most recent interglacial, an interval that started about 10,000 years ago and is called the Holocene Epoch by geologists. Sea levels during several previous interglacials were about 3 to as much as 20 meters higher than current sea level. The evidence comes from two different but complementary types of studies. One line of evidence is provided by old shoreline features (fig. 2). Wave-cut terraces and beach deposits from regions as separate as the Caribbean and the North Slope of Alaska suggest higher sea levels during past interglacial times. A second line of evidence comes from sediments cored from below the existing Greenland and West Antarctic ice sheets. The fossils and chemical signals in the sediment cores indicate that both major ice sheets were greatly reduced from their current size or even completely melted one or more times in the recent geologic past. The precise timing and details of past sea-level history are still being debated, but there is clear evidence for past sea levels significantly higher than current sea level. 
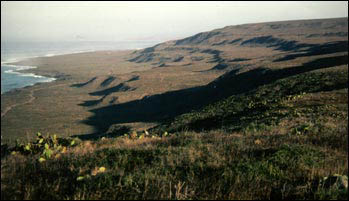
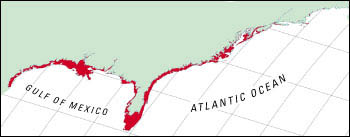
Figure 2. Wave-cut terraces on San Clemente Island, California. Nearly horizontal surfaces, separated by step-like cliffs, were created during former intervals of high sea level; the highest terrace represents the oldest sea-level high stand. Because San Clemente Island is slowly rising, terraces cut during an interglacial continue to rise with the island during the following glacial interval. When sea level rises during the next interglacial, a new wave-cut terrace is eroded below the previous interglacial terrace. Geologists can calculate the height of the former high sea levels by knowing the tectonic uplift rate of the island. Photograph by Dan Muhs, USGS. Potential Sea-Level ChangesIf Earth’s climate continues to warm, then the volume of present-day ice sheets will decrease. Melting of the current Greenland ice sheet would result in a sea-level rise of about 6.5 meters; melting of the West Antarctic ice sheet would result in a sea-level rise of about 8 meters (table 1). The West Antarctic ice sheet is especially vulnerable, because much of it is grounded below sea level. Small changes in global sea level or a rise in ocean temperatures could cause a breakup of the two buttressing ice shelves (Ronne/Filchner and Ross). The resulting surge of the West Antarctic ice sheet would lead to a rapid rise in global sea level. Reduction of the West Antarctic and Greenland ice sheets similar to past reductions would cause sea level to rise 10 or more meters. A sea-level rise of 10 meters would flood about 25 percent of the U.S. population, with the major impact being mostly on the people and infrastructures in the Gulf and East Coast States (fig. 3). Researchers at the U.S. Geological Survey and elsewhere are investigating the magnitude and timing of sea-level changes during previous interglacial intervals. Better documentation and understanding of these past changes will improve our ability to estimate the potential for future large-scale changes in sea level. 
Figure 3. Red shows areas along the Gulf Coast and East Coast of the United States that would be flooded by a 10-meter rise in sea level. Population figures for 1996 (U.S. Bureau of the Census, unpublished data, 1998) indicate that a 10-meter rise in sea level would flood approximately 25 percent of the Nation's population.
|
First posted January 2000 For additional information contact: Part or all of this report is presented in Portable Document Format (PDF); the latest version of Adobe Reader or similar software is required to view it. Download the latest version of Adobe Reader, free of charge. |
||||||||||||||||||||||||
Poore, R.Z., Williams, R.S., Jr., and Tracey, Christopher, 2000, Sea level and climate: U.S. Geological Survey Fact Sheet 002–00, 2 p., at https://pubs.usgs.gov/fs/fs2-00/.