INTRODUCTION
The Cape Cod glacial aquifer is an example of an aquifer that consists of extensive outwash sheets that buried preglacial topography. The outwash deposits consist largely of fine to coarse sand and gravel. Glacial-lake clay, silt, and very fine to fine sand, as well as unsorted till, are interbedded as layers and lenses in the thick outwash deposits.
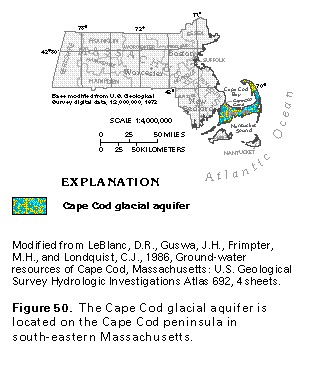
The Cape Cod glacial aquifer underlies Cape Cod, Mass., which is a hook-shaped peninsula that extends about 40 miles into the Atlantic Ocean from the southeastern part of the State and has a north-trending extremity about 25 miles in length (fig. 50). The peninsula has an area of about 440 square miles and a maximum altitude of 309 feet above sea level. The cape is surrounded by seawater, even on the west where saltwater in the Cape Cod Canal separates the peninsula from the mainland. The resident population was estimated to be about 168,000 in 1985; in the summer, the influx of tourists swells the population to almost three times that number. Residents and tourists get freshwater from the glacial aquifer, which is recharged solely from precipitation.
GEOLOGY
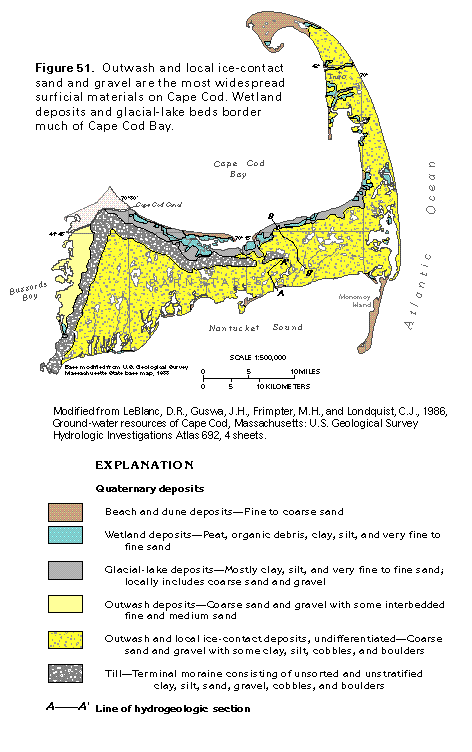
The sediments on Cape Cod were deposited at or near the terminus of an ice sheet and consist of sandy terminal moraines (fig. 51) and an assortment of associated thick, sandy till, ice-contact, outwash, and glacial-lake deposits resting on crystalline bedrock. The bedrock surface slopes eastward from 80 to about 900 feet below sea level. The overlying glacial deposits range in thickness from 100 feet along the Cape Cod Canal to about 1,000 feet at Truro near the northern end of the peninsula. The wetland deposits and the beach and dune deposits shown in figure 51 are postglacial deposits.
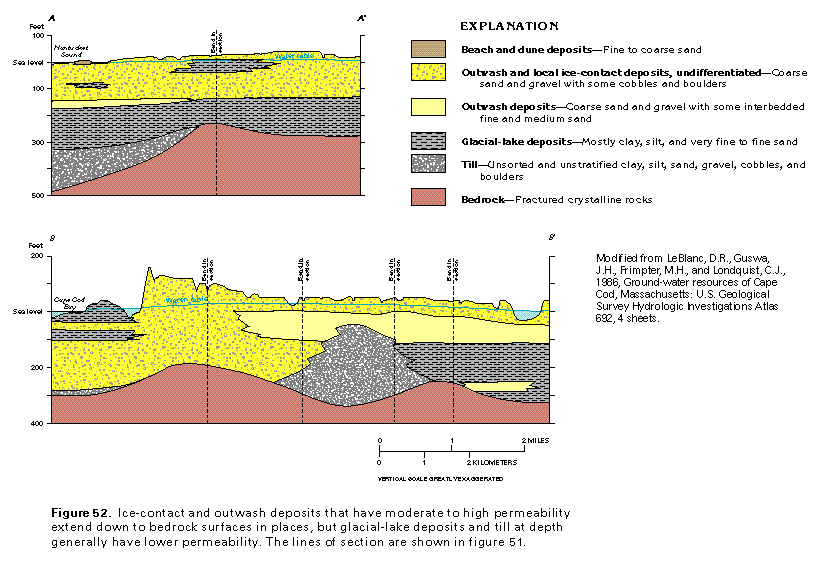
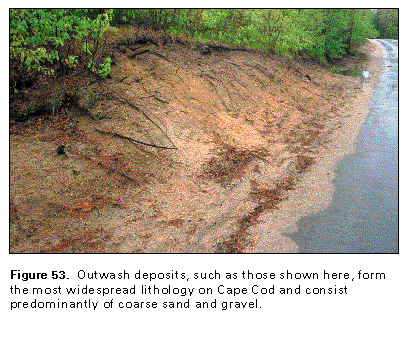
Coarse sand and gravel outwash, including local ice-contact deposits, is by far the most extensive type of glacial deposit at the land surface (fig. 51) and in the subsurface (fig. 52). The outwash consists predominantly of coarse sand and gravel (fig. 53) but contains fine sand in places. The outwash ranges in thickness from 50 to 200 feet and locally is interbedded with or overlies fine-grained glacial-lake deposits or till, as indicated in section B-B' of figure 52. Outwash sand and gravel generally has moderate to high permeability and forms the most productive aquifer on the cape.
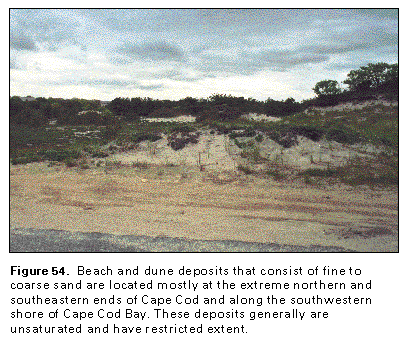
Beach and dune deposits, which consist of fine to coarse sand (figs. 51, 54), are dispersed around the periphery of the peninsula but have only small areal extent and, although permeable, tend to be thin and largely unsaturated; accordingly, these deposits have virtually no potential for development of ground-water supplies. Glacial-lake and wetland deposits extend along the south shore of Cape Cod Bay (fig. 51). The glacial-lake deposits formed in a temporary lake, which was associated with retreat of the glacial ice, and consist of clay, silt, and very fine sand with some interbedded outwash sand and gravel. Generally, these deposits have minimal to moderate permeability. A terminal moraine that consists of till (poorly sorted sand and gravel with lenses of clay and silt) extends parallel to, but slightly inland from, Buzzards Bay and part of Cape Cod Bay. The hydrogeologic sections in figure 52 show that till and lacustrine clay and silt are common at depth. These fine-grained materials tend to have minimal permeability and yield only small quantities of water to wells.
HYDROLOGY
The Cape Cod glacial aquifer is recharged by the part of the water from precipitation that is not returned to the atmosphere by evapotranspiration or that does not run off directly to streams or other surface-water bodies. Because of the permeable nature of the soils on the cape, an estimated 45 percent of the average annual precipitation of 40 inches rapidly soaks into the soil and becomes ground-water recharge. An estimated 55 percent of the precipitation is evapotranspired, and less than 1 percent runs off directly to streams, ponds and lakes, or saltwater bodies.
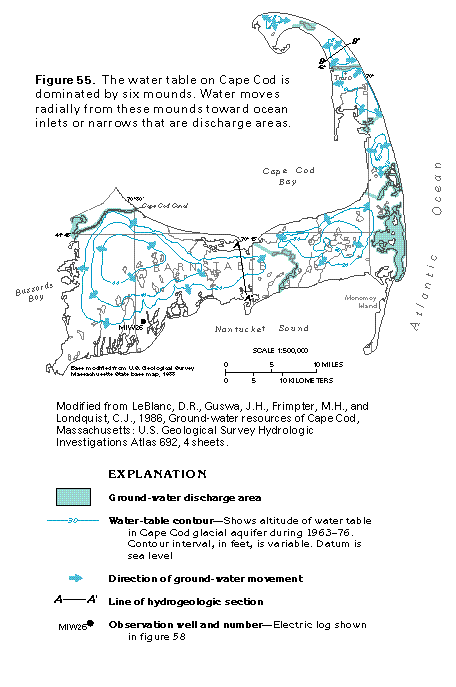
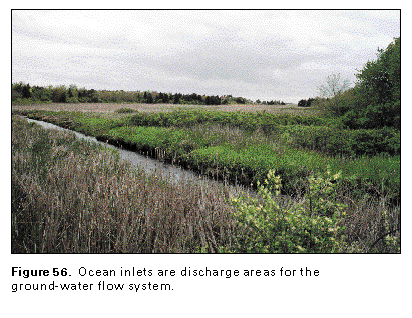
Water that enters the soil percolates downward through an unsaturated zone until it reaches the water table. The water table of the Cape Cod glacial aquifer (fig. 55) is not a flat surface, but is dominated by six low mounds, which are highest at the greatest distance from the coastline. Thus, there is a hydraulic gradient on the ground-water reservoir reflected by differences in elevation of the water table. Water moves in response to this hydraulic gradient, from high areas to low areas, where it is discharged from the aquifer back to the land surface or directly to the ocean. The six mounds, or cells, are separated by ocean inlets or narrows, similar to the one shown in figure 56, that act as discharge areas. Under natural conditions, the cells are hydraulically independent ground-water flow systems. Ground-water flow in each of the six cells is steady because of a long-term balance between ground-water recharge and discharge. The configuration of the flow cells remains approximately the same from year to year. A computer analysis of the aquifer estimated that the total flow through the six systems is about 270 million gallons per day.
Thus, water movement through the aquifer, as indicated by the arrows in figure 55, is radially outward from the center of the mounds toward ocean inlets and to Buzzards Bay, the Cape Cod Canal, Nantucket Sound, Cape Cod Bay, and the Atlantic Ocean.
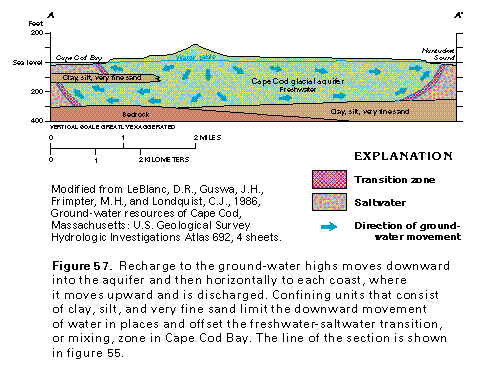
Ground-water flow in the vertical dimension is illustrated by the hydrogeologic section through the cape shown in figure 57. Flow is nearly horizontal in much of the aquifer. Vertical flow occurs mainly at recharge areas near water-table highs and at major discharge areas, such as the coast.
The lower boundary of the ground-water flow system is bedrock or slightly permeable glacial deposits, such as silt and very fine sand, or the transition, or mixing, zone between freshwater and saltwater in the aquifer. In the northern part of the cape, freshwater is underlain everywhere by saltwater. At Truro, the freshwater zone is about 200 feet thick and it might be thicker elsewhere on the outer cape. In the inner- and mid-cape areas, the freshwater zone extends to bedrock. In places near the ocean, fine-grained sediments mark the lower boundary of freshwater (fig. 57).
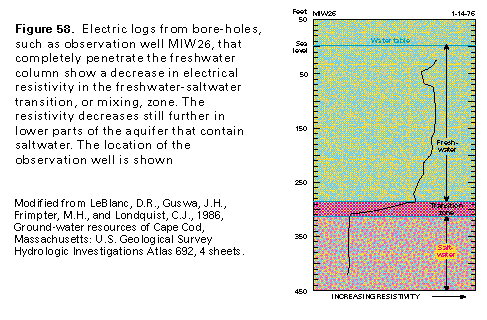
Freshwater and saltwater in the aquifer are separated by a narrow transition zone where mixing occurs. In this zone, freshwater that is moving seaward mixes by hydrodynamic dispersion and diffusion with saltwater that is moving landward. Freshwater and saltwater remain separated because flow in the transition zone is not turbulent and because of the difference in density between freshwater and saltwater. The transition zone is easily identified on electric logs from wells that penetrate the zone, as shown in figure 58.
The transition zone can move landward or seaward depending on the steepness of the hydraulic gradient in the water-table mounds. For example, during a drought, when the height of the water-table mounds is lowered and the hydraulic gradient becomes flatter, decreased seaward flow of freshwater would allow the transition zone to move landward. Because of the long-term steady-state conditions of the flow system on the cape, however, the location of the transition zone generally remains stable.
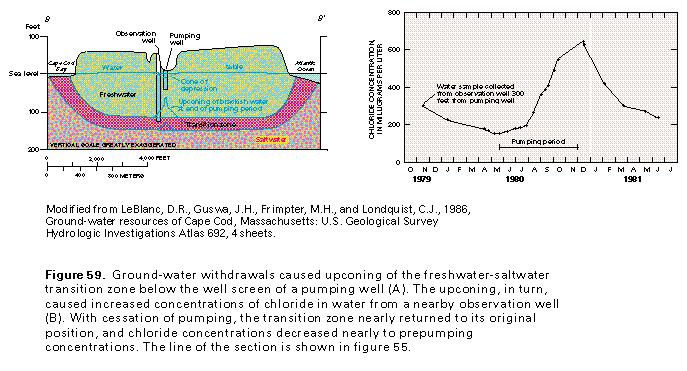
The transition zone also can move in response to ground-water withdrawals. Withdrawals decrease the seaward flow of freshwater by capturing the freshwater that would move toward the ocean. Thus, the transition zone moves toward pumping wells; this results in an increase in salinity, as indicated by an increase in chloride concentrations in freshwater at the well. The increase of chloride concentrations in water from an observation well located 300 feet from a pumping well is shown in figure 59A. Withdrawals caused upconing (movement of the transition zone upward toward the pumping well) with a resulting increase in chloride concentrations in water from the nearby observation well (fig. 59B). Note that with cessation of pumping, the transition zone nearly returned to its prepumping position with a resulting decrease in chloride concentrations in water from the observation well.
GROUND-WATER QUALITY
The chemical quality of water in the Cape Cod glacial aquifer generally is suitable for most uses, including human consumption. The rapid rate of recharge, short ground-water flow paths, chemically inert character of the quartz and feldspar sand that comprise the aquifer, and the unconfined conditions all contribute to minimal mineralization of the water. For example, a median dissolved-solids concentration of 70 milligrams per liter was reported for 196 samples of water from the Cape Cod glacial aquifer (table 9).
Water-quality problems do, however, occur on the cape. Excessive concentrations of iron, manganese, and hydrogen sulfide might be detected in the water where dune deposits overlie wetland deposits. Large concentrations of iron deep in the aquifer inhibit development of water supplies from deep wells. Contamination of the aquifer by nitrogen from land disposal of municipal sewage, septic-tank effluent, fuel spills and fertilizers is a problem locally, and contamination by road salt and saltwater spray might be a problem in coastal areas. Landfills and lagoons used for disposal of sewage by septic-tank pumpers also are sources of ground-water contamination. Large-scale withdrawal of water near the periphery of the cape might induce saltwater to move into the aquifer either laterally or by upconing from depth.
FRESH GROUND-WATER WITHDRAWALS
Fresh ground-water withdrawals from the Cape Cod aquifer amounted to 16 million gallons per day during 1985 (fig. 60). Nondomestic water use, which was mostly for public supply, accounted for 14.8 percent of withdrawals, and withdrawals for agricultural use were 1.6 percent. The remainder and majority of the withdrawals, 83.6 percent, was for domestic and commercial use.