National Assessment of Coastal Vulnerability to Sea-Level Rise:
Preliminary Results for the U.S. Atlantic Coast
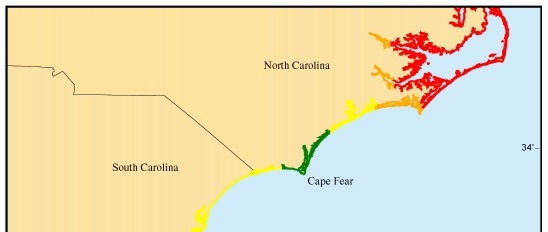
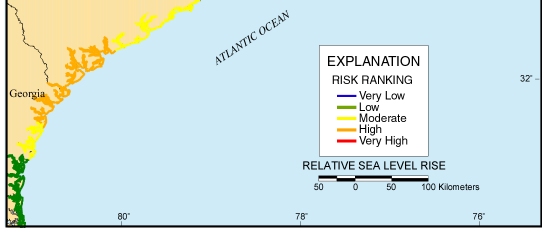
Figure 10. Map of the relative sea-level rise variable for the NorthCarolina to Georgia region. The rate of sea-level change is lowest at Cape Fear, North Carolina, due to long-term tectonic uplift of the mid-Carolina Platform High.
 |
 |
| Contents | Back to Top | Title Page |
| Introduction | Risk Variables |
Data Ranking |
CVI | Results | Discussion | Summary | References |
|
Web Page by
Donna Newman [an error occurred while processing this directive] |