National Assessment of Coastal Vulnerability to Sea-Level Rise:
Preliminary Results for the U.S. Atlantic Coast
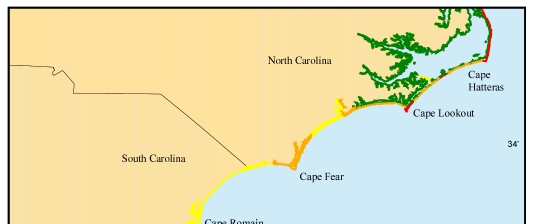
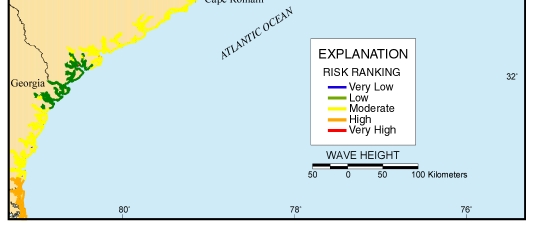
Figure 11. Map of mean wave height variable for North Carolina to Georgia region. The risk due to wave height varies between the north and south sides of Cape Hatteras and Cape Lookout, and generally decreased from Cape Hatteras southward into the Georgia embayment. This reflects differences in wave exposure due to shoreline orientation, as well as the increasing continental shelf width from North Carolina to Georgia.
 |
 |
| Contents | Back to Top | Title Page |
| Introduction | Risk Variables |
Data Ranking |
CVI | Results | Discussion | Summary | References |
|
Web Page by
Donna Newman [an error occurred while processing this directive] |