U.S. Department of the Interior
U.S. Geological Survey
Prepared in cooperation with the National Aeronautics and Space Administration and Brigham
Young University
Preliminary interpretation of seasonal movement of the Slumgullion landslide
as determined from GPS observations, July 1998 - July 1999
by J.A. Coe1, J.W. Godt1,
W.L. Ellis1, W.Z. Savage1, J. E. Savage2, P.S. Powers1, D.J. Varnes1,
and P. Tachker3
1 U.S. Geological Survey, Denver, CO
2 Colorado School of Mines, Department of Geology and Geological Engineering, Golden, CO
3 Institut Des Sciences Et Techniques De Grenoble, Département Géotechnique, Grenoble,
France
|
(Click for larger image.)
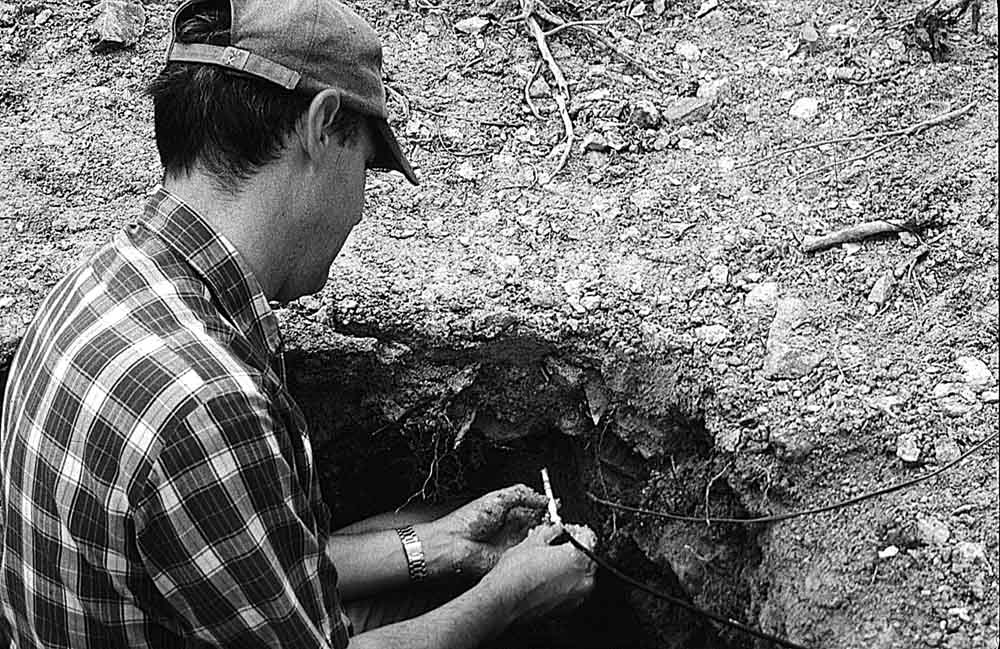
Installation of a soil temperature probe in the landslide. Data from the probe, as well as from
other monitoring instruments, were used to interpret seasonal slide movement.
|
This report is preliminary and has not been reviewed for conformity with U.S. Geological Survey
editorial standards or with the North American Stratigraphic Code. Any use of trade, product, or firm names is
for descriptive purposes only and does not imply endorsement by the U.S. Government.
Open-File Report 00-102
on-line edition
2000
Abstract
Six sets of 19 GPS observations made between July 1998 and
July 1999 show that the Slumgullion landslide in southwest Colorado moved throughout the year, but that daily velocities
were highly variable on a seasonal basis. Seasonal variability in velocities is probably due to ground water levels
that decrease when surface water is unavailable or cannot infiltrate frozen ground and increase when surface water
from melting snow or rainfall infiltrates unfrozen ground. This hypothesis is supported by data showing seasonal
changes in soil-water content and by a correspondence between velocity variability and air- and soil-temperature
data from a meteorological station on the slide. In general, slide movement increased or decreased with rising
or falling temperatures. Velocities of the middle and upper parts of the slide, which peaked between May and July,
correlate with temperature especially well. Velocities of lower part of the slide, which peaked between March and
May, correlate less well. This discrepancy in times of peak movement is probably due to the elevation difference
between the lower and upper parts of the slide. Air temperatures at the lower part of the slide are probably 2-5
ºC (5-9 ºF) warmer than the upper part, which causes earlier spring melting of frozen ground and snow
and a subsequent increase in velocities.
Annual movements and daily velocities were smallest at the head and toe
of the landslide and largest in the central, narrowest part of the landslide. Movements and velocities deviated
from this distribution in areas where they were affected by major structural elements within the slide. Movement
occurred near the head of the slide on landslide deposits that were previously identified as inactive. Annual movements
of the lower and middle parts of the slide were greater than any previously documented.
Introduction and Setting
The Slumgullion landslide is located about 5 km southwest of Lake City in
the San Juan Mountains of southwestern Colorado (fig. 1). The landslide is about 6 km
long and ranges in elevation from about 2750 to 3650 m. The active part of the landslide is about 3.5 km long and
ranges in elevation from about 2950 to 3650 m.
|
(Click for a larger image.)
Figure 1. Location map showing the active and inactive parts of the Slumgullion landslide. Also see location
of Snotel site.
|
The landslide is in the montane and subalpine ecological zones as defined
by Löve (1970). Vegetation on the slide consists predominantly of deformed, open stands of Englemann spruce
and aspen. Vegetation surrounding the slide consists of closed stands of conifers and aspen.
Meteorological data collected between October, 1993 and December, 1999 at
a Snotel weather station (Western Regional Climate Center, U.S. Department of Agriculture unpublished data, 1999)
located about 4 km southeast of the head of the slide at an elevation of 3520 m (fig. 1)
reveal the following observations about precipitation and temperature conditions in the area. Annual precipitation
totals ranged from 50-90 cm, about two-thirds of which came in the form of snow between October and June. Extreme
temperatures ranged from -31ºC (-23ºF) on December 17, 1996 to 24ºC (76ºF) in July, 1995 and
June and July, 1998. Average daily temperatures ranged from -27ºC (-16ºF) on December 17, 1996 to 15ºC
(59ºF) on July 18, 1998.
The main scarp of the landslide occurs in Tertiary volcanic rocks of the
Uncompahgre-San Juan caldera complex. Many of these rocks are highly altered by acid-sulfate hydrothermal alteration
(Diehl and Schuster, 1996). The landslide is predominantly a yellow, sandy-silty-clay with scattered patches of
bouldery debris. The lower portion of the slide contains large patches of reddish-brown and purple clay. The clay-rich
landslide material has medium to high plasticity and high swelling potential (Chleborad and others, 1996).
Although the landslide has been observed and studied since the late 1800s.
(e.g., Endlich, 1876; Atwood and Mather, 1932; Crandell and Varnes, 1961; Varnes and Savage, 1996), with the exception
of limited observations by Savage and Fleming, (1996), little is known regarding the nature and magnitude of movements
in response to seasonal variations and short-term meteorological changes, and nothing is known regarding the effect
of surface and subsurface water on such movements. Previous studies (Crandell and Varnes, 1961; Powers and Chiarle,
1996; Smith, 1996; Baum and Fleming, 1996; Fleming and others, 1999) have documented annual rates of movement ranging
from 0.5 m/yr at the head and toe of the slide, up to about 6 m/yr in the narrowest part of the slide (for example,
see fig. 2). Several additional studies have documented movements over shorter periods
of time. Jackson and others (1996) used GPS to measure daily velocities of up to 1 cm/day at 6 locations during
a 4 day period in June, 1993. Savage and Fleming (1996) measured velocities over a 9 month period (April 1993 -
January, 1994) at 3 locations on the landslide and documented an increase of movement in the spring, presumably
with thawing of the landslide surface. They inferred that variations in velocity over the course of a year were
in part due to hydrologic controls, but suggested that, because of the remarkable long-term record of relatively
constant movement, the landslide might contain various internal mechanisms to counterbalance changing meteorologic
and hydrologic conditions that act to decrease or increase the velocity of slide movement. For example, high ground-water
pressures following a wet winter might be equilibrated through a network of springs, which would bleed off excess
water and decrease ground-water pressures. Although some preliminary mapping of springs and sinks has been completed
(Fleming and others, 1999), the overall hydrology of the landslide and its relation to movement and meteorology
is unknown.
|
(Click for a larger image.)
Figure 2. Active part of the Slumgullion landslide with structural elements, contours of mean annual movement,
GPS base stations, control points, and monitoring points. See Coe and others (2000) for a description of base stations
and control points. Modified from Baum and Fleming (1996).
|
In 1998, Brigham Young University (BYU) and the USGS began work on a 3-year
NASA-funded study of the Slumgullion landslide. The objectives of the study are to: 1) measure movement of the
entire active part of the landslide on a seasonal basis using GPS, and an airborne, interferometric capable, Synthetic
Aperture Radar and/or Scanning Microwave Altimeter remote sensing system; 2) attempt to correlate the measured
movement with observed temperature, rainfall, snow depth, and ground- and surface-water levels and pressures, 3)
evaluate the remote sensing systems for monitoring the movement of landslides by confirming a static velocity field
surrounding the landslide and by comparing remotely sensed movement data to simultaneous measurements at GPS points
and to previously measured deformation rates, and 4) develop a model for landslide deformation based on all of
the combined data. BYU is responsible for designing, building, and operating the remote sensing system(s). Current
(January, 2000) plans call for the acquisition of airborne remote sensing data beginning in the summer of 2000.
The USGS is responsible for monitoring movement using GPS, as well as monitoring hydrologic and meteorologic fluctuations
on the slide.
The purpose of this report is to present a preliminary interpretation of
seasonal movement as determined from GPS observations between July 1998 and July 1999. The GPS observations, methods,
and movement data are summarized in a separate report (Coe and others, 2000). We interpret seasonal movements in
the context of selected hydrologic and meteorologic data. The entire set of hydrologic and meteorologic data will
be published as a separate report. We also compare annual movements from 1998/1999 to previously measured annual
movements. Below, we first review the movement data (from Coe and others, 2000), then briefly describe meteorological
conditions during the 1998/1999 monitoring year, and then follow with our interpretation.
Landslide movements determined by GPS observations
GPS observations were made at 19 monitoring points (MP1-MP19, fig. 2) on
the active portion of the landslide. Observations were made during six, 2-day field campaigns. The dates of the
six campaigns were as follows: July 28-29, 1998; October, 21-22, 1998; January 5-6, 1999; March 23-24, 1999; May
11-12, 1999; and July 27-28, 1999. All monitoring points moved between each set of observations. Total movement
(combined horizontal and vertical movement) was largely dominated by the horizontal component. In a general sense,
annual horizontal movements and average annual velocities are smallest near the head and toe of the landslide and
increase to a peak at the central, narrowest part (neck) of the landslide (fig. 3 and
fig. 4). Annual horizontal movements ranged from 0.15 m at MP1 to 7.3 m at MP12 (fig. 3a). Average daily horizontal velocities over the year-long monitoring period ranged
from <0.001 m/day at MP1 to 0.020 m/day at MP12 (fig 3b). Annual vertical movements
ranged from less than 0.01 m at MP1 to 1.29 m at MP10. All points, except MP16, moved downslope. MP16 moved upward
(see discussion below).
|
(Click for a larger image.)
Figure 3. Bar graph showing the distribution of a) annual horizontal movement and b) average daily horizontal
velocities over the year-long monitoring period.
|
Velocities of individual points varied considerably according to the season,
with minimum values ranging from 10-66 percent of maximum values (fig 5). The largest
differences occurred at points near the head of the slide (MP1, MP2, MP5) where the seasonal minimum velocities
were 10-27 percent of the seasonal maximums. The smallest differences occurred at points in the neck of the slide
(MP9, MP10, MP12, MP11, MP14, and MP13) where the seasonal minimums were 63-66 percent of the seasonal maximums.
|
(Click for a larger image.)
Figure 4. Diagram showing cumulative horizontal movement of monitoring points. Ending dates of GPS campaigns
are shown.
|
|
(Click for a larger image.)
Figure 5. Bar graph showing the ratio of minimum velocity to maximum velocity at each monitoring point.
|
Minimum and maximum velocities occurred at different times on different
parts of the slide (fig. 6). At 15 of the 19 monitoring points (MP1-MP15), maximum velocities
occurred between May 12 and July 28 (referred to as summer throughout the remainder of the report). At the remaining
four points (MP16-MP19), located at the lowest elevations near the toe of the slide, maximum velocities occurred
between March 24 and May 12 (referred to as spring throughout the remainder of the report). Minimum velocities
at all points, except MP17 (briefly discussed below), occurred between January 6 and March 24. At MP17, the minimum
velocity occurred between October 22 and January 6.
|
(Click for a larger image.)
Figure 6. Diagram showing daily velocities of monitoring points. Dates shown are periods between GPS observations.
|
Meteorological Conditions During the 1998/99 Monitoring Year
Meteorological data collected since October, 1993 at the Slumgullion Pass
Snotel station about 4 km southeast of the head of the landslide (fig. 1) show that
the 1998 water year (October 1, 1997 to September 30, 1998) was average in terms of precipitation, but that the
1999 water year was the wettest on record during the 6 year period with about 89 cm (35 in.) of precipitation (fig. 7). Much of this anomalous precipitation occurred during the spring and summer. In
the summer, the Slumgullion slide and the entire state of Colorado were subjected to a prolonged flow of monsoonal
moisture that triggered numerous and widespread landslides and debris flows (see Colorado Geological Survey, 1999).
|
(Click for a larger image.)
Figure 7. Precipitation, snow-water content, and air-temperature data from the Slumgullion Pass Snotel station
for the period October 1, 1993 to December 29, 1999.
|
Air temperatures since Oct. 1993 show a distinct seasonal cycle with minimum
temperatures occurring between mid-December and mid-January and maximums occurring between mid-June and mid-July
(fig. 7). Between July 1998 and July 1999, the lowest temp ( -24 ºC, –12 ºF)
occurred on February 11 and the highest temperature (21º C, 70º F) occurred on June 28 (fig.
8). Measurable snowfall began in October, 1998 and lasted through May, 1999. Average daily temperatures dropped
below freezing for the winter season on November 28, 1998 and rose above freezing for the first time in the spring
on April 12, 1999.
|
(Click for a larger image.)
Figure 8. Precipitation, snow-water content, and air-temperature data from the Slumgullion Pass Snotel station
for the period July 1, 1998 to August 1, 1999.
|
Preliminary Interpretation
Probable causes for seasonal variability in velocity
Seasonal variations in velocity imply that slide movement is
affected by seasonal changes within the landslide. Although one year of movement data is not entirely sufficient
to link seasonal changes in movement to other seasonal changes (for example, meteorologic or hydrologic changes),
all currently available data suggest that seasonal changes in movement are probably related to changing subsurface
water levels that are controlled by the infiltration of surface water. The infiltration of surface water is a function
of the availability of water from snowmelt or rainfall and the nature of the slide material (frozen or unfrozen).
Frozen ground can dramatically decrease surface water infiltration by blocking
soil pores with ice (Kane, 1980; Kane and Stein, 1983; Stähli and others, 1999). Water content of the soil
is the primary factor that controls the degree to which freezing changes infiltration. Infiltration rates decrease
with increasing water content. Previous work has shown that the soil-water content of the clay-rich, Slumgullion
slide material is high (38-56 percent, Chleborad and others, 1996), suggesting that infiltration rates would be
dramatically reduced by freezing.
Soil-water content and soil-temperature data collected during the 1998/1999
monitoring period at USGS Instrumentation Station 1 (IS1, fig. 2) indicate that the
soil-water content at Slumgullion was high prior to, and following, freezing and that the surface-water infiltration
was reduced during the winter months when the ground was frozen (figs. 9 and 10).
Soil-water content data were collected using two different types of instruments, a Water Content Reflectometer
(WCR in fig. 9) and two soil-moisture sensors (ST in fig. 9).
The WCR determines volumetric water content based on the dielectric constant of the surrounding soil, which is
sensitive to the soil-water content. The ST sensors are electronic resistant devices that are used to provide estimates
of soil tension, which is related to the soil-water content (refer to figure 9 caption
for further details). Because the operating principles of both types of instruments rely on the presence of liquid
water, the meaning of the sensor’s response with respect to water content in frozen ground is uncertain. For this
reason we focus the following discussion on the soil-water content data that were obtained in non-frozen soil.
|
(Click for a larger image.)
Figure 9. Volumetric soil-water content and soil tension at IS1 in relation to daily velocities of monitoring
points MP8 and MP16 (see figure 2 for locations). Volumetric soil-water content (WCR)
was measured at a depth of 0.2 m using a Campbell Scientific, Inc., Water Content Reflectometer (model CS615).
The reflectometer uses time-domain measurement methods to determine the volumetric water content using an empirically
derived calibration equation supplied by the manufacturer. Although Campbell Scientific suggests that the calibration
equation is accurate within a few percent for a wide range of soil types and textures, a calibration curve has
not yet been determined for the Slumgullion slide material. Therefore, the absolute values of volumetric water
contents reported here should be considered estimates. Estimates of soil tension (ST) were obtained at depths of
0.2 and 1.0 m using Watermark model 200 soil moisture sensors manufactured by Irrometer Company, Inc. These sensors
are electronic resistance devices whose output has been empirically calibrated to soil tension, also known as soil
suction (see Eldredge and others, 1993). Saturated to near-saturated soil moisture conditions produce less negative
soil tension values, whereas dryer soil moisture conditions result in more negative soil tension values. Guidelines
from Irrometer suggest that saturated soils produce soil tension values ranging from 0 to –10 kPa, whereas dry
soils are typically in the range of –100 to –200 kPa. Velocities of MP8 are representative of points MP1 – MP15
on the upper and middle parts of the slide (see fig. 6). Velocities of MP16 are representative of points MP16 –
MP19 on the lower part of the slide. Velocities are plotted at the mid-points between GPS observations.
|
Soil water content data show that, with the exception of the winter months,
slide material at a depth of 0.2 m had a volumetric water content that ranged from about 36-64 percent and was
between 35-45 percent for most of the year (WCR, fig. 9). Soil moisture data from depths
of 0.2 and 1 m show that, with the exception of the winter months, the slide material was saturated or nearly saturated
(low soil tensions) for most of the year (ST, fig. 9). The response of the soil-moisture
sensor at a depth of 0.2 m indicates a sudden and large apparent increase in soil tension in early December, 1998.
This sensor response corresponds to ground freeze at 0.2 m depth as indicated by the soil temperature data (fig. 10). Likewise, the sudden and large decrease in soil tension shown by the 0.2 m sensor
in late April, 1999, corresponds to the onset of ground thaw (see soil temperature plot in fig.
10). The soil-moisture sensor response during this period of ground freeze is not considered meaningful with
respect to soil tension, or therefore, as an indicator of water content. The soil-moisture sensor at 1 m depth
does not show the dramatic response attributed to freezing at the 0.2 m depth, and the soil-temperature data also
indicated that the ground at the 1 m depth did not freeze (fig. 10). The soil-moisture
sensor at 1 m depth does, however, show an increase in soil tension from about –5 kPa to about –30 kPa during the
winter months, indicating a decrease in soil-moisture content at this depth when the ground above was frozen (fig. 9).
|
(Click for a larger image.)
Figure 10. Air and soil temperatures measured at IS1 in relation to daily velocities of monitoring points MP8
and MP16 (see figure 2 for locations). All temperatures were measured with Campbell
Scientific, Inc. temperature probes (model 107). The air-temperature probe (air T) was equipped with a solar radiation
shield. Soil-temperature probes were installed at depths of 0.2 m (T@20 cm) and 1 m (T@100 cm). Velocities of MP8
are representative of points MP1 - MP15 on the upper and middle parts of the slide. Velocities of MP16 are representative
of points MP16 - MP19 on the lower part of the slide. Velocities are plotted at the mid-points between GPS observations.
|
Relation between velocity variability, soil-water content, and temperature
There is a correspondence between variations in velocities of monitoring
points and soil-water content, soil temperature, and air temperature data from IS1 (figs.
9 and 10). The strongest correspondence is to soil and air temperature. In general,
slide movement increases or decreases with rising or falling temperatures (fig. 10).
The correspondence is probably due to the control that air temperature has on the freezing and thawing of ground
and snow, which in turn controls the influx of surface water, and ultimately the ground-water level within the
slide. Rising or falling ground-water levels would tend to respectively decrease or increase the effective normal
stress at the basal surface of the slide. According to the effective stress law (Terzaghi, 1943), a reduction in
effective normal stress requires a corresponding reduction in resisting shear stress along the base of the slide.
The velocity of the slide, therefore, would increase or decrease as ground-water level rises or falls.
The correspondence of velocity and temperature is especially strong for
points MP1-MP15 (represented by MP8 in figs. 9 and 10) located
above 3040 m on the upper and middle parts of the slide. There is less of a correspondence at points MP16-MP19
(represented by MP16 in figs. 9 and 10) located below an
elevation of 3040 m on the lower part of the slide. The 3040 m elevation coincides approximately with the location
of a large pond that may have been created when the toe of the active slide emerged from, and overrode old landslide
deposits (see Parise and Guzzi, 1992; Fleming and others , 1999; and discussion below). Velocities of points on
the upper and middle parts of the slide peak in the summer, whereas velocities of points on the lower part of the
slide peak in the spring. Similar observations have been reported for the Aspen Grove landslide in Utah (Baum and
others, 1993).
The difference in velocity peaks is probably caused by warmer temperatures
at the toe of the slide than at the middle and upper parts. There is a 500 m difference in elevation between the
lowest and highest parts of the slide. Adiabatic temperature lapse rates (9.8 ºC and 5 ºC per thousand
meters of elevation for dry and wet air, respectively, from Barry, 1992) suggest that air temperatures for the
lowest part of the slide are 2.5 to 4.9 ºC (4.5 to 8.8 ºF) warmer than those at the upper part of the
slide. This difference in temperature would cause ground on the lower part of the slide to remain unfrozen for
longer periods of time than that at higher elevations. Additionally, snow would melt faster on the lower part of
the slide as compared to the upper part. Furthermore, observations of snow depth made during winter GPS surveys
indicate that less snow falls on the lower part of the slide than on the upper and middle parts. Less snow and
more rapid snowmelt suggest that the period of spring surface-water infiltration would be earlier and shorter on
the lower part of the slide than on the upper and middle parts. The difference in the amount of snowfall and the
rate of snowmelt on the upper and lower parts of the slide is readily visible in spring months (for example, see
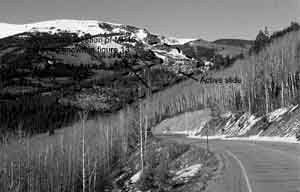
fig. 11). Thawing and melting of frozen ground and snow on the lower part of the slide
in the spring probably raises the ground-water level within the slide which increases the slide velocity. In the
summer, when ground-water levels and velocities are decreasing on the lower part of the slide, they are peaking
on the upper and middle parts of the slide when snowmelt there is at a maximum.
|
(Click for a larger image.)
Figure 11. Springtime distribution of snow on the active part of the Slumgullion landslide. View is to the northeast.
Photo taken May 10, 1999.
|
Inconsistent velocity response to seasonal changes
The upper part of the slide reacts more dramatically to seasonal changes
than the middle and lower parts. Maximum velocities of points on the upper part of the slide are up to 10 times
greater than minimum velocities, whereas for most of the lower and middle parts of the slide, maximum velocities
are about 1.6 times greater than minimum velocities. The dramatic change along the upper part of the slide could
be due to several factors. First, because of the high elevation (3400-3650 m) of the head of the slide, prolonged
periods of frozen ground could dramatically decrease ground-water levels for long periods of time. Second, as mentioned
above, more snow falls on the upper and middle parts of the slide than on the lower part. The melting of this snow
in the spring and summer would provide a larger influx of surface water than that received by the lower part of
the slide.
Relation between landslide structures and velocities
Velocities vary gradually along the length of the landslide, with the smallest
velocities occurring at points near the head and toe, and largest velocities occurring in the neck. This overall
distribution resembles a normal distribution and is consistent with patterns established by earlier photogrammetric
studies (Powers and Chiarle, 1996; Smith, 1996). The velocity distribution appears to be largely a function of
the hour-glass shaped lateral boundaries of the slide (Fleming and others, 1996; also observed at the Aspen Grove
landslide in Utah by Baum and others, 1993). Locally however, velocities deviate from the approximately normal
distribution according to the location of major structural elements. This is especially evident at points located
in pull-apart basins and on opposite sides of southwest-northeast trending strike-slip faults (see fig.
2). Velocities of points MP11 and MP17, for example, are anomalously low when compared to surrounding points
(fig. 4). MP11 is located in a pull-apart basin along the north flank where the northern
boundary of the slide widens (described by Baum and Fleming, 1996; and Fleming and others, 1999) and MP17 is located
on the northwest moving side (appendix A, MP17) of a strike-slip fault along the north flank of the toe. Velocities
of MP13 and MP14, which are about 150 m apart (fig. 2), but on opposite sides of a large
strike-slip fault, are significantly different, with MP14 on the southern side moving about 20% faster than MP13
on the northern side (first observed by Fleming and others, 1999).
Movement of MP1
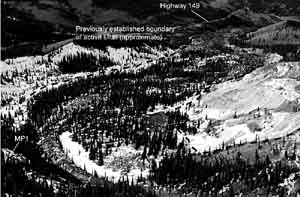
Movement of MP1 was somewhat unexpected because the point is located on
an old landslide flank ridge on a part of the slide that was previously mapped as inactive (figs.
1, 2, and fig. 12). The average horizontal velocity
of the point was 0.0006 m/day for an annual horizontal movement of 0.21 m toward the southwest (downslope, see
Coe and others, 2000, appendix, MP1). The point was installed in an attempt to verify that the old landslide deposits
were indeed inactive. Movement of the point suggests that at least some of the old deposits in the vicinity of
the head of the slide are active. The movement also suggests that control points (used to register remote sensing
imagery to a local coordinate system, see Coe and others, 2000), which are often located on old flank ridges around
the periphery of the active slide, should be resurveyed to verify that no movement is occurring.
|
(Click for a larger image.)
Figure 12. Monitoring point MP1 in relation to the previously established boundary of the active slide. Boundary
from Baum and Fleming, 1996. View is to the southwest. See Highway 149 in the distance for scale.
|
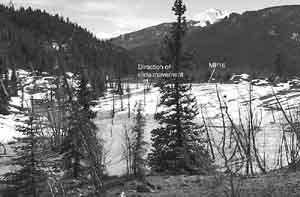
Movement of MP16
Point MP16, located on pond sediments just southwest of a pond on the lower
part of the slide (fig. 13), is moving upslope (see Coe and others, 2000, appendix,
MP16). All other monitoring points are moving downslope. The point increased 0.18 m in elevation between July 1998
and 1999. Previous studies (Parise and Guzzi, 1992; Fleming and others, 1999) have suggested that the location
of the pond is controlled by a depression at the basal surface of the slide which was created when the toe of the
active slide emerged and overrode old landslide deposits. By emerging from, and overriding existing deposits, debris
in the active slide was backtilted, forming a closed depression that pools water. These studies also suggested
that the pond location remains fixed over time while landslide debris is transported into the pond, receives a
coating of pond sediments, and is then transported out of the pond. The upward movement of MP16 and a backtilted
trail of pond sediments southwest of the pond (fig. 13) supports this hypothesis.
|
(Click for a larger image.)
Figure 13. Monitoring point MP16. Backtilted pond sediments surround MP16.
|
Comparison of velocities to previously measured velocities
A comparison of velocities measured in this study to velocities reported
in previous studies reveals that annual horizontal velocities of 12 of the 19 monitoring points are greater than
any previously documented for the same locations (fig. 14). Velocities from this study
are higher at points downslope from MP6 (see fig. 2), but lower at points MP2-MP6, on
the upper part of the slide. Although several exceptions to this observation exist (fig.
14), most notably at MP17 where velocities in this study are all lower than those previously documented, the
overall pattern is consistent and convincing.
|
(Click for a larger image.)
Figure 14. Bar graph showing annual horizontal movement of individual points compared to previous measurements.
|
The reasons for these velocity disparities are unclear, although several
possibilities seem plausible. First, at least some of the differences are due to inherent differences in measurement
techniques. Annual velocities in previous studies were determined by averaging movement measured from photo identifiable
features in aerial photographs taken in 1985 and 1990. Movement in this study was measured over the course of a
single year. Movement during one or more years between 1985 and 1990 may have been very similar to 1998/99 measurements
but would have been muted by averaging with slower movements from other years. A second explanation for the disparities
may be that annual velocity (when measured during a single year) is moderately variable in time and that velocities
on different parts of the slide vary somewhat episodically. In this scenario, the lower and middle parts of the
slide moved faster in 1998/99 than between 1985 and 1990, and the upper part moved slower in 1998/99 than between
1985 and 1990. Continued monitoring during this study should help to clarify variability in annual movement.
Conclusions
We suggest that seasonal variability in daily landslide velocities during
the 1998/1999 monitoring period was probably caused by changing ground-water levels that were primarily controlled
by the infiltration of surface water, which in turn was controlled by the availability of water and the state of
the slide material (frozen or unfrozen). Soil temperature and soil-water content data from the middle part of the
slide indicate that frozen ground between December, 1998 and May, 1999 reduced the infiltration of surface water
into the landslide, probably causing a period of minimum velocities (January-March). Spring snowmelt and/or rainfall
accompanied by surface-water infiltration into the landslide were probably responsible for velocity maximums between
March and May on the lower portion of the slide and between May and July on the middle and upper portions of the
slide.
In general, annual and seasonal velocities are greatest at the neck of the
landslide and gradually decrease both upslope and downslope with the lowest velocities occurring at the head and
toe of the slide. Locally, landslide structures cause velocities to vary from this distribution. Some of the movement
documented near the head of the slide occurred on landslide deposits previously thought to be inactive.
A comparison of annual movements measured in 1998/1999 to those measured
between 1985 and 1990 revealed that movement was greater in 1998/1999 on the lower and middle parts of the slide,
but less in 1998/1999 on the upper part of the slide. Continued monitoring should help to further clarify annual
and seasonal variability in movement.
Acknowledgments
We thank Bob Fleming and Mark Reid for suggestions that helped focus the
study. Rex Baum had helpful suggestions throughout the study and also provided a critical review of this report.
This study was funded by the NASA Solid Earth and Natural Hazards research program (NRA-MTPE-1997-10), Principal
Investigator, David Arnold, Brigham Young University, Co-Investigator, Jeff Coe, USGS.
References Cited
Atwood, W.W. and Mather, K.F., 1932, Physiography and Quaternary geology of the San Juan mountains, Colorado:
U.S. Geological Survey Professional Paper 166, 176 p.
Barry, R.G., 1992, Mountain weather and climate, Routledge, London, 2nd ed., 402 p.
Baum, R.L., Fleming, R.W., and Johnson, A.M., 1993, Kinematics of the Aspen Grove landslide, Ephraim Canyon,
central Utah, U.S. Geological Survey Bulletin 1842-F, 34 p.
Baum, R.L. and Fleming, R.W., 1996, Kinematic studies of the Slumgullion landslide, Hinsdale County, Colorado:
in Varnes, D.J. and Savage, W.Z., eds., The Slumgullion Earth Flow: A large-scale natural laboratory, U.S.
Geological Survey Bulletin 2130, p. 9-12.
Coe, J.A., Godt, J.W., Ellis, W.L., Savage, W.Z., Savage, J.E., Powers, P.S., Varnes, D.J., and Tachker, P.,
2000, Seasonal movement of the Slumgullion landslide as determined by GPS observations, July 1998 - July 1999:
U.S. Geological Survey Open-File Report 00-101, 47p.
Chleborad, A.F., Diehl, S.F., and Cannon, S.H., 1996, Geotechnical properties of selected materials from the
Slumgullion landslide: in Varnes, D.J. and Savage, W.Z., eds., The Slumgullion Earth Flow: A large-scale
natural laboratory, U.S. Geological Survey Bulletin 2130, p. 67-71. Colorado Geological Survey, 1999, ROCKTALK,
v. 2, no. 4, 16 p.
Crandell and Varnes, 1961, Movement of the Slumgullion Earthflow near Lake City, Colorado, in Short papers
in the geologic and hydrologic sciences: U.S. Geological Survey Professional Paper 424-B, p. B136-B139.
Diehl, S.F. and Schuster, R.L., 1996, Preliminary geologic map and alteration mineralogy of the main scarp of
the Slumgullion landslide: in Varnes, D.J. and Savage, W.Z., eds., The Slumgullion Earth Flow: A large-scale
natural laboratory, U.S. Geological Survey Bulletin 2130, p. 13-19.
Eldredge, E.P., Shock, C.C., and Steiber, T.D., 1993, Calibration of granular matrix sensors for irrigation
management: Agronomy Journal, v. 85, n. 6, p. 1228-1232.
Endlich, F.M., 1876, Report of F.M. Endlich, in U.S. Geological and Geographical Survey (Hayden) of the Territories
Annual Report 1974, p. 203.
Fleming, R.W., Baum, R.L., and Savage, W.Z., 1996, The Slumgullion landslide, Hinsdale County, Colorado,
in Thompson, R.A., Hudson, M.R., and Pillmore, C.L., eds., Geologic Excursions to the Rocky Mountains and Beyond:
Geological Society of America Special Publication 44, Annual Meeting, 21 p.
Fleming, R.W., Baum, R.L., and Giardino, M., 1999, Map and description of the active part of the Slumgullion
Landslide, Hinsdale County, Colorado: US Geological Survey Miscellaneous Investigation Series Map I-2672.
Jackson, M.E., Bodin, P.W., Savage, W.Z., and Nel, E.M., 1996, Measurement of local velocities on the Slumgullion
landslide using the Global Positioning System: in Varnes, D.J. and Savage, W.Z., eds., The Slumgullion Earth
Flow: A large-scale natural laboratory, U.S. Geological Survey Bulletin 2130, p. 93-95.
Kane, D.L., 1980, Snowmelt infiltration into seasonally frozen soils: Cold Regions Science and Technology: v.
3, p. 153-161.
Kane, D.L. and Stein, J., 1983, Water movement into seasonally frozen soils: Water Resources Research, v. 19,
no. 6, p. 1547-1557.
Löve, D, 1970, Subartic and subalpine - where and what?: Artic and Alpine Research, v. 2, p. 63-72.
Parise, M. and Guzzi, R., 1992, Volume and shape of the active and inactive parts of the Slumgullion landslide,
Hinsdale County, Colorado: U.S. Geological Survey Open-File Report 92-216, 29 p.
Powers, P.S. and Chiarle, M., 1996, A digital photogrammetric method to measure horizontal surficial movements
on the Slumgullion landslide, Hinsdale County, Colorado: in Varnes, D.J. and Savage, W.Z., eds., The Slumgullion
Earth Flow: A large-scale natural laboratory, U.S. Geological Survey Bulletin 2130, p. 51-55.
Savage, W.Z. and Fleming, R.W., 1996, Slumgullion landslide fault creep studies, in Varnes, D.J. and
Savage, W.Z., eds., The Slumgullion Earth Flow: A large-scale natural laboratory, U.S. Geological Survey Bulletin
2130, p 73-76.
Smith, W.K., 1996, Photogrammetric determination of slope movements on the Slumgullion landslide: in
Varnes, D.J. and Savage, W.Z., eds., The Slumgullion Earth Flow: A large-scale natural laboratory, U.S. Geological
Survey Bulletin 2130, p. 57-60.
Stähli, M, Jansson, P., and Lundin, L., 1999, Soil moisture redistribution and infiltration in frozen sandy
soils: Water Resources Research, v. 35, no. 1, p. 95-103.
Terzaghi, K., 1943, Theoretical soil mechanics, John Wiley and Sons, New York, p. 510.
Varnes, D.J., Smith, W.K., Savage, W.Z., and Powers, P.S., 1996, Deformation and control surveys, Slumgullion
landslide: in Varnes, D.J. and Savage, W.Z., eds., The Slumgullion Earth Flow: A large-scale natural laboratory,
U.S. Geological Survey Bulletin 2130, p. 43-49.
Varnes, D.J. and Savage, W.Z., 1996, The Slumgullion Earth Flow: A large-scale natural laboratory, U.S. Geological
Survey Bulletin 2130, 95 p.
|
 |